5 Best Internet Providers in Haywood City, MO
Find internet availability by address in Haywood City, MO
Jump to: Best Internet Provider | Availability Maps | Customer Reviews | Haywood City ISP Report Card | Business Internet in Haywood City
| Haywood City ISP Report Card | B | |
| Download Speed for Most Households | 1,000 Mbps | |
| Number of Internet Service Providers | 5 | |
| Real Haywood City Customer Ratings | 0 |
This page reflects the most recent FCC update from January 06, 2026, based on the Broadband Data Collection as of June 30, 2025.
This page reflects the most recent FCC update from January 06, 2026, based on the Broadband Data Collection as of June 30, 2025.
Haywood City has 5 internet service providers, they are sorted by coverage, available speed, and customer rating from our unbiased internet provider report. Cable, Fiber, Fixed Wireless, and DSL internet are available in the city. Reviews are grouped by provider and the type of service they offer, covering all 4 available internet technologies in Haywood City.
Haywood City overview
▼
Haywood City has 5 internet service providers, they are sorted by coverage, available speed, and customer rating from our unbiased internet provider report. Cable, Fiber, Fixed Wireless, and DSL internet are available in the city. Reviews are grouped by provider and the type of service they offer, covering all 4 available internet technologies in Haywood City.
Compare Providers Ranked by Coverage, Speed, and Customer Ratings
SEMO Electric Cooperative
Connection
Customer Rating
Fiber

EarthLink
Connection
Customer Rating
DSL

Fixed Wireless
AT&T
Connection
Customer Rating
DSL

Fixed Wireless
Spectrum
Connection
Customer Rating
Cable

Above are the top 4 providers in Haywood City, MO for most people based on high speed internet coverage, speeds, and customer reviews. Click below to see all providers in your city.
Speed and technology may vary by address for all providers. Please note we may have a financial relationship with some of the providers above, which does not impact the customer ratings displayed. Customer ratings listed above are national ratings, local Haywood City ratings may vary and are shown below.
Who is the Best Internet Provider in Haywood City, MO?
AT&T is the highest-rated internet provider in Haywood City based on 75 Missouri customer reviews, and T-Mobile Home Internet has the highest rating nationwide. The provider information above and the information immediately below can help you decide. Compare provider ratings and review counts above.
The chart and table below show average customer ratings from customers in Haywood City, Missouri, and customers throughout the country.
Top Rated Internet Providers in Haywood City
Local, State, and National Ratings for all Haywood City Internet Providers
| ISP / Tech Type | Haywood City Overall | Missouri Overall | National Overall | For Service | ||
|---|---|---|---|---|---|---|
| T-Mobile Home Internet | (0) | (12) | (284) | View Plans | ||
| AT&T | (0) | (28) | (924) | View Plans | ||
| Spectrum | (0) | (62) | (1738) | View Plans | ||
| HughesNet | (0) |  (1) (1) |  (18) (18) | View Plans | ||
| EarthLink | (0) | (0) | (12) | View Plans | ||
| Viasat | (0) | (0) | (11) | View Plans | ||
| SEMO Electric Cooperative | (0) | (0) | (0) | View Plans |
Based on 75 reviews from Missouri internet customers, AT&T is the best internet service provider for Haywood City residents. AT&T was rated at an average of 3.70 out of 5 in our report for overall customer satisfaction. T-Mobile Home Internet wins for second-place in Missouri, with 3.67 out of 5 stars and 99.5% coverage in Haywood City.
At a national level, based on 2996 national reviews for any of the providers listed above, T-Mobile Home Internet is rated higher than any other provider, with a rating of 4.02 out of 5.
Which Providers are Available at my Home in Haywood City?
a different provider.
Internet Availability Key
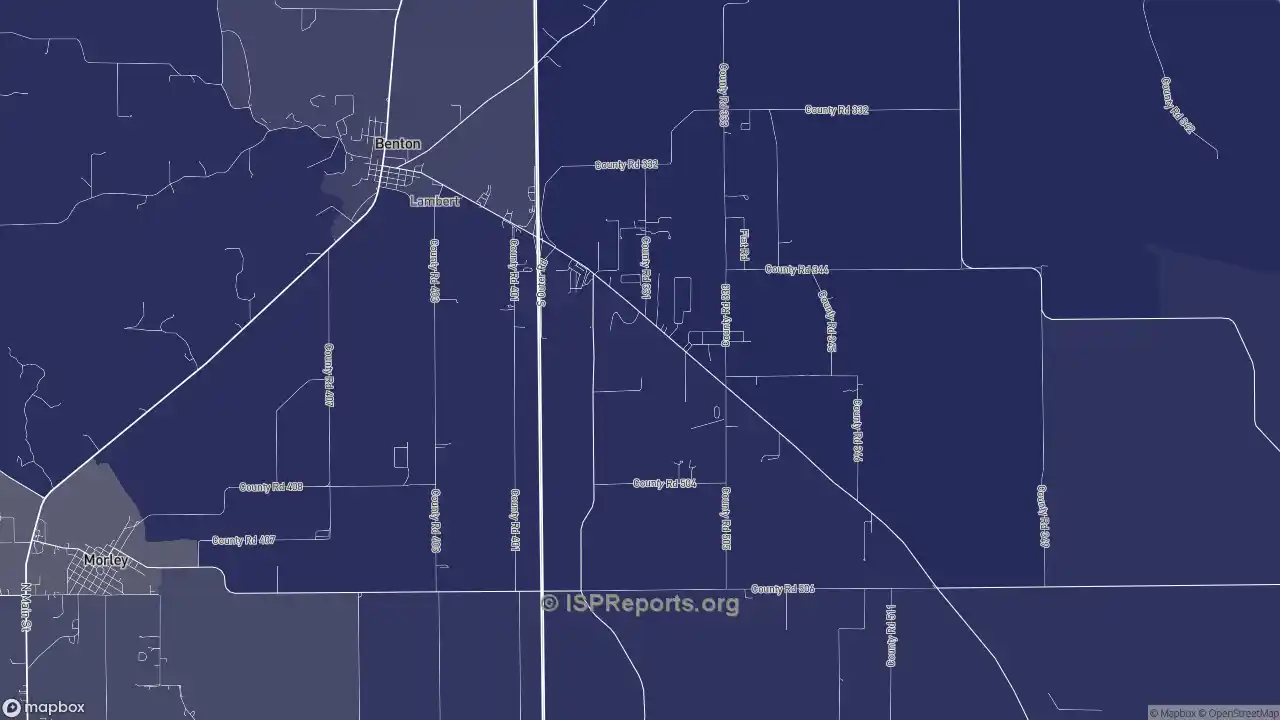
Speeds and coverage vary within the city, and sometimes even from block to block. The map shows speeds per provider and where each provider is available.
Who is the Fastest Internet Provider in Haywood City?
According to unbiased feedback from real internet customers in the city, they reported being happiest with speeds provided by Spectrum. On the other hand, based on data provided by the internet providers to the FCC, SEMO Electric Cooperative and Spectrum should have faster speeds at a local level. While we typically put more weight on real-world customer ratings, we display both satisfaction and technical maximum information for customers to decide for themselves.
Data Reported to FCC by ISPs: Average Maximum Available in Haywood City
| ISP / Tech Type | Max Advertised Speed | ||
|---|---|---|---|
| Spectrum | 1,000 Mbps | ||
| SEMO Electric Cooperative | 1,000 Mbps | ||
| AT&T | 100 Mbps | ||
| EarthLink | 100 Mbps | ||
| T-Mobile Home Internet | 100 Mbps | ||
| Viasat | 100 Mbps | ||
| HughesNet | 25 Mbps |
Customer Ratings for Internet Provider Speeds in Haywood City
| ISP / Tech Type | Haywood City Speed | Missouri Speed | National Speed | For Service | ||
|---|---|---|---|---|---|---|
| T-Mobile Home Internet | (0) | (12) | (284) | View Plans | ||
| AT&T | (0) | (28) | (924) | View Plans | ||
| Spectrum | (0) | (62) | (1738) | View Plans | ||
| HughesNet | (0) | (1) | (18) | View Plans | ||
| EarthLink | (0) | (0) | (12) | View Plans | ||
| Viasat | (0) | (0) |  (11) (11) | View Plans | ||
| SEMO Electric Cooperative | (0) | (0) | (0) | View Plans |
Based on data reported by Haywood City ISPs to the FCC, the fastest speeds in the city are available through SEMO Electric Cooperative and Spectrum. These internet providers offer speeds up to 1,000 Mbps in Haywood City. Therefore, the average customer can get up to 1,000 Mbps if they're willing to purchase the fastest subscription tier available at their homes.
Additionally, actual customers in the city rated their satisfaction with internet speed highest with Spectrum. This indicates Spectrum reliably delivers speeds expected by the customer based on the plan they are paying for.
Who is the Cheapest Internet Provider in Haywood City?
Missouri customers rate T-Mobile Home Internet as the cheapest internet service provider in state. Data comes from customers in the state rating their satisfaction with pricing. This feedback is valuable because it considers price changes and whether the speeds paid for are worth it.
T-Mobile Home Internet received a local rating of 4.22 out of 5, which is higher than the average across all internet providers in the country. AT&T is rated in second place for affordability by the company’s Haywood City customers with an average price rating of 3.43 out of 5.
The chart and graph below show how customers in Haywood City, Missouri, and the United States rated the affordability of their internet service.
Rated Affordability in Haywood City
| ISP / Tech Type | Haywood City Affordability | Missouri Affordability | National Affordability | For Service | ||
|---|---|---|---|---|---|---|
| T-Mobile Home Internet | (0) |  (12) (12) | (284) | View Plans | ||
| AT&T | (0) | (28) | (924) | View Plans | ||
| Spectrum | (0) | (62) | (1738) | View Plans | ||
| HughesNet | (0) | (1) | (18) | View Plans | ||
| EarthLink | (0) | (0) | (12) | View Plans | ||
| Viasat | (0) | (0) | (11) | View Plans | ||
| SEMO Electric Cooperative | (0) | (0) | (0) | View Plans |
Haywood City Internet Health Assessment
ISP Reports evaluates the technological infrastructure across the United States. This includes assessing a grade for ISP providers and infrastructure in the city and setting an index number for the digital connectivity of its residents. You can view the ISP Report Card and the Digital Connectivity Index for Haywood City below, including the metrics used and how Haywood City compares to the rest of Missouri and nation.
| Metric
(hover for details)
|
Haywood City | Missouri | USA | ||
|---|---|---|---|---|---|
| Fiber Availability Percent The percentage of households in Haywood City that have a Fiber internet connection available to their home. | 100.00% | 72.02% | 67.25% | ||
| Average Download SpeedThe maximum download speed most households can get on average. This is measured by availability in a block group and weighted by the population in that area. | 1,000 Mbps | 3,199 Mbps | 3,293 Mbps | ||
| Provider CountThe number of providers available for most people. This is a weighted average by block rather than a total for Haywood City. | 5.0 | 7.5 | 6.8 |
| Average Household SizeA larger household size in a city indicates that there will be a greater need for bandwidth due to simultaneous usage, multiple devices, and network congestion. | 2.5 | 2.5 | 2.7 | ||
| Work From Home PercentA higher percent of the population working from home indicates bandwidth requirements being more widely needed rather than consolidated to commercial portions of the city. | 4% | 12% | 14% | ||
| Households with DevicesA higher percentage of households with computing devices in the home indicates a higher level of infrastructure needed to support those households. | 94% | 94% | 95% | ||
| Households with InternetA higher percentage of households with internet indicates a higher need for usage and connectivity in people’s daily lives. | 83% | 89% | 90% | ||
| Households with BroadbandA higher percentage of households with a broadband connection (defined as speeds above 25 Mbps) indicates heavier usage needs within these households. | 55% | 70% | 75% | ||
| Broadband Usage vs. AvailabilityThis measures what percentage of households who have a broadband connection to their home actually have an active subscription to that service. | 55% | 71% | 76% |
Our demographic data is sourced from the latest 5-year release of the American Community Survey by the US Census Bureau.
Haywood City ISP Report Card & Digital Connectivity Index
The ISP Report Card in Haywood City is B, which is worse than other cities. The local demand for broadband internet connectivity in Haywood City is high with a score of 35 / 100 in our Digital Connectivity Index. This means that internet service providers operating in Haywood City have done a poor job meeting the needs of its residents.
The Haywood City ISP Report Card evaluates the city on availability and speed metrics compared to other cities in the United States. ISP Infrastructure can vary greatly and on its own isn’t a perfect measure of what a city needs. Please see our ISP Report Card along with the Digital Connectivity Index above to evaluate how well the connectivity demand is met by the existing infrastructure.
83% of Haywood City households have an internet connection despite having 100.00% availability. 55% of households have fiber, cable, or DSL, 8% have satellite, 0% are still on dial-up, and 2% of households have internet but don’t pay for a subscription because it’s subsidized by the Affordable Connectivity Program.
As you can see in the table above, while 55% of households have a broadband connection such as fiber, cable or DSL available to their home, 55% subscribe to it. A low number of Haywood City residents are taking advantage of the available internet infrastructure.
For more details, please visit our ISP Report Card and Digital Connectivity Index pages.
How do Neighboring Cities Compare to Haywood City?
- ISP Report Card: C
- Digital Connectivity Index: 52 / 100
- ISP Report Card: C
- Digital Connectivity Index: 60 / 100
- ISP Report Card: D+
- Digital Connectivity Index: 47 / 100
- ISP Report Card: C
- Digital Connectivity Index: 62 / 100
- ISP Report Card: C+
- Digital Connectivity Index: 25 / 100
- ISP Report Card: C-
- Digital Connectivity Index: 50 / 100
- ISP Report Card: C-
- Digital Connectivity Index: 31 / 100
- ISP Report Card: C+
- Digital Connectivity Index: 55 / 100
- ISP Report Card: C+
- Digital Connectivity Index: 59 / 100
How Much Speed does a Haywood City Household Need?
Higher speed is typically preferred, but that comes at a higher price. The average size of a household in Haywood City is 2.5, which is larger than the Missouri average of 2.5 and smaller than the national average of 2.7. Haywood City's average household income is $51,811 which is much lower than the Missouri average of $78,421 and much lower than the national average of $90,606. Homes with more people living in them and with lower incomes tend to indicate a fairly average device usage pattern.
Haywood City also has 9% of its population enrolled in school between the 6th grade and college level, this is lower than the Missouri average of 15%. Additionally, 4% of residents work from home, which is lower than the 12% of residents in Missouri who work from home. This and other factors you can see above show us that the community of Haywood City has a low need for internet connectivity and speeds.
Compared to the rest of the country, Haywood City households are about average when it comes to technological engagement. 94% of households have some sort of computing device, 66% have desktops or laptops in the home, and 92% have smartphones. To see what speeds you are currently getting, please visit our internet speed test tool.
Which Fiber Internet Providers are Available in Haywood City?
SEMO Electric Cooperative Fiber in Haywood City, MO
Availability:
100.0%
Customer Rating:
(0)
Avg. Download Speed
1,000 Mbps
SEMO Electric Cooperative offers Fiber service to 100.0% of Haywood City homes. Across the city, SEMO Electric Cooperative Fiber is the only type of service available from the company, with speeds up to 1,000 Mbps
Which Cable Internet Providers are Available in Haywood City?
Spectrum Cable in Haywood City, MO
Availability:
32.9%
Customer Rating:
(1,618)
Avg. Download Speed
1,000 Mbps
Spectrum offers Cable service to 32.9% of Haywood City homes. Across the city, Spectrum Cable is the only type of service available from the company, with speeds up to 1,000 Mbps
Which DSL Internet Providers are Available in Haywood City?
EarthLink DSL in Haywood City, MO
Availability:
43.6%
Customer Rating:
(4)
Avg. Download Speed
31 Mbps
EarthLink offers DSL service to 43.6% of Haywood City homes. Across the city, EarthLink DSL has speeds up to 31 Mbps, with speeds from 10 Mpbs up to 50 Mbps depending on the address. Upload speeds differ from download speeds, and are as low 1.0 and as high as 10, with an average of 5.7 Mbps throughout the city. EarthLink DSL is rated the same as other types of internet service available in Haywood City from EarthLink in terms of customer satisfaction.
AT&T DSL in Haywood City, MO
Availability:
43.6%
Customer Rating:
(304)
Avg. Download Speed
31 Mbps
AT&T offers DSL service to 43.6% of Haywood City homes. Across the city, AT&T DSL has speeds up to 31 Mbps, with speeds from 10 Mpbs up to 50 Mbps depending on the address. Upload speeds differ from download speeds, and are as low 1.0 and as high as 10, with an average of 5.7 Mbps throughout the city. AT&T DSL is rated about the same as other types of internet service available in Haywood City from AT&T in terms of customer satisfaction.
Which Fixed Wireless and LTE Internet Providers are Available in Haywood City?
T-Mobile Home Internet Fixed Wireless in Haywood City, MO
Availability:
99.5%
Customer Rating:
(0)
Avg. Download Speed
65 Mbps
T-Mobile Home Internet offers Fixed Wireless service to 99.5% of Haywood City homes. Across the city, T-Mobile Home Internet Fixed Wireless is the only type of service available from the company, with speeds up to 65 Mbps, with speeds from 25 Mpbs up to 100 Mbps depending on the address. Upload speeds differ from download speeds, and are as low 3.0 and as high as 20, with an average of 12 Mbps throughout the city.
EarthLink Fixed Wireless in Haywood City, MO
Availability:
90.8%
Customer Rating:
(0)
Avg. Download Speed
39 Mbps
EarthLink offers Fixed Wireless service to 90.8% of Haywood City homes. Across the city, EarthLink Fixed Wireless has speeds up to 39 Mbps, with speeds from 25 Mpbs up to 100 Mbps depending on the address. Upload speeds differ from download speeds, and are as low 3.0 and as high as 20, with an average of 6.2 Mbps throughout the city.
AT&T Fixed Wireless in Haywood City, MO
Availability:
90.8%
Customer Rating:
(0)
Avg. Download Speed
39 Mbps
AT&T offers Fixed Wireless service to 90.8% of Haywood City homes. Across the city, AT&T Fixed Wireless has speeds up to 39 Mbps, with speeds from 25 Mpbs up to 100 Mbps depending on the address. Upload speeds differ from download speeds, and are as low 3.0 and as high as 20, with an average of 6.2 Mbps throughout the city.
Which ISP Should You Choose in Haywood City?
The right ISP for you depends upon your needs, but in general we can make the following suggestions:
- The best all-around internet service provider in Haywood City is AT&T.
- The fastest internet provider should be SEMO Electric Cooperative and Spectrum. Considering speed for the money and reliability in speeds, Spectrum may be a better choice based on real-world local customer feedback.
- The most affordable internet provider in Haywood City is T-Mobile Home Internet.
- Viasat, SEMO Electric Cooperative, and HughesNet has the broadest coverage in Haywood City, and is most likely to cover your home. To find out exactly what's available at your home, please use our address search tool.
How does Haywood City compare to other cities with a similar population?
To see how Haywood City stacks up on the national level, it's useful to look at some other cities with similarly sized populations. Below you can see a list of these cities and how they compare to Haywood City's B ISP Report Card and 35 / 100 Digital Connectivity Index.
- ISP Report Card: C
- Digital Connectivity Index: 70 / 100
- ISP Report Card: C-
- Digital Connectivity Index: 44 / 100
- ISP Report Card: B+
- Digital Connectivity Index: 53 / 100
- ISP Report Card: A
- Digital Connectivity Index: 95 / 100
- ISP Report Card: D-
- Digital Connectivity Index: 57 / 100
- ISP Report Card: D+
- Digital Connectivity Index: 30 / 100
- ISP Report Card: F
- Digital Connectivity Index: 53 / 100
- ISP Report Card: B-
- Digital Connectivity Index: 41 / 100
- ISP Report Card: C+
- Digital Connectivity Index: 42 / 100
Customer Reviews
Customer Reviews for Internet Service Providers in Missouri
Customer Reviews
Melissa P
Centurylink DSL
January 21, 2026 CenturyLink is a very decent Internet provider. Speeds are above average. I have only had a few episodes of "No Internet" due to storms but CenturyLink was able to quickly fix the issue & had my Internet service up & running within a few hours.
More
A Columbia, MO Customer
Socket Fiber
 January 20, 2026
 I like that the price isn't "discounted" for a year or two so that it automatically gets jacked up after a while like a lot of companies do.
More
Kristen H
Gateway Fiber
December 29, 2025 My internet provider was wonderful at first . They came to my house , had to dig through my yard. Cleaned up really well. For the first six months speeds were great . After that , everything loads slowly. We have a deal for our internet so we pay a great price , but I’ve had them hard reset it multiple times . It’s good for a few days then back to bad !
More
A Webster Groves, MO Customer
AT&T Fiber
December 25, 2025 More
Kristen P
AT&T DSL
December 22, 2025 I would like better options for speed and reliability that don't seem like I'm being priced like I am a family of 3. I've been with AT&T since they bought out Southwestern Bell, and would hope my seniority of their service would give me some leverage, but I guess it doesn't. I think most pricing for internet is despicable and generally at the beheft of huge corporations who give could care less about people who can barely affordable even decent internet with the economic climate we are in.
More
Rate your provider
Share your experience to help others in your area choose.
Verified customer: we detected your connection is on this provider.
Don't see your provider? Search all providers
Reviews are independent and unedited. Published after a quick spam check.