6 Best Internet Providers in San Gorgonio, Highland, CA
Find internet availability by address in San Gorgonio, Highland, CA
Jump to: Best Internet Provider | Availability Maps | Customer Reviews | San Gorgonio ISP Report Card | Business Internet in San Gorgonio
| San Gorgonio ISP Report Card | C+ | |
| Download Speed for Most Households | 1,289 Mbps | |
| Number of Internet Service Providers | 6 | |
| Real San Gorgonio Customer Ratings | 0 |
This page reflects the most recent FCC update from January 06, 2026, based on the Broadband Data Collection as of June 30, 2025.
This page reflects the most recent FCC update from January 06, 2026, based on the Broadband Data Collection as of June 30, 2025.
San Gorgonio has 6 internet service providers, they are sorted by coverage, available speed, and customer rating from our unbiased internet provider report. Cable, Fiber, DSL, and Fixed Wireless internet are available in the neighborhood. Reviews are grouped by provider and the type of service they offer, covering all 4 available internet technologies in San Gorgonio.
San Gorgonio overview
▼
San Gorgonio has 6 internet service providers, they are sorted by coverage, available speed, and customer rating from our unbiased internet provider report. Cable, Fiber, DSL, and Fixed Wireless internet are available in the neighborhood. Reviews are grouped by provider and the type of service they offer, covering all 4 available internet technologies in San Gorgonio.
Compare Providers Ranked by Coverage, Speed, and Customer Ratings
Spectrum
Connection
Customer Rating
Cable

EarthLink
Connection
Customer Rating
Fiber

DSL
Fixed Wireless

AT&T
Connection
Customer Rating
Fiber
DSL

Fixed Wireless
Frontier
Connection
Customer Rating
Fiber
Above are the top 4 providers in San Gorgonio, Highland, CA for most people based on high speed internet coverage, speeds, and customer reviews. Click below to see all providers in your neighborhood.

Speed and technology may vary by address for all providers. Please note we may have a financial relationship with some of the providers above, which does not impact the customer ratings displayed. Customer ratings listed above are national ratings, local San Gorgonio ratings may vary and are shown below.
Who is the Best Internet Provider in San Gorgonio, Highland, CA?
Frontier Communications is the highest-rated internet provider in San Gorgonio based on 359 Highland customer reviews, and T-Mobile Home Internet has the highest rating nationwide. The provider information above and the information immediately below can help you decide. Compare provider ratings and review counts above.
The chart and table below show average customer ratings from customers in San Gorgonio, California, and customers throughout the country.
Top Rated Internet Providers in San Gorgonio
Local, State, and National Ratings for all San Gorgonio Internet Providers
| ISP / Tech Type | San Gorgonio Overall | California Overall | National Overall | For Service | ||
|---|---|---|---|---|---|---|
| Frontier | (1) | (42) | (143) | View Plans | ||
| Spectrum | (1) | (203) | (1738) | View Plans | ||
| T-Mobile Home Internet | (0) | (22) | (284) | View Plans | ||
| Verizon | (0) | (24) | (723) | View Plans | ||
| AT&T | (0) | (107) | (924) | View Plans | ||
| HughesNet | (0) | (1) |  (18) (18) | View Plans | ||
| Viasat | (0) | (1) |  (11) (11) | View Plans | ||
| EarthLink | (0) | (2) | (12) | View Plans |
Based on 359 reviews from Highland internet customers, Frontier Communications is the best internet service provider for San Gorgonio residents. Frontier Communications was rated at an average of 3.85 out of 5 in our report for overall customer satisfaction. T-Mobile Home Internet wins for second-place in Highland, with 3.84 out of 5 stars and 99.9% coverage in San Gorgonio.
At a national level, based on 3877 national reviews for any of the providers listed above, T-Mobile Home Internet is rated higher than any other provider, with a rating of 4.02 out of 5.
Which Providers are Available at my Home in San Gorgonio?
a different provider.
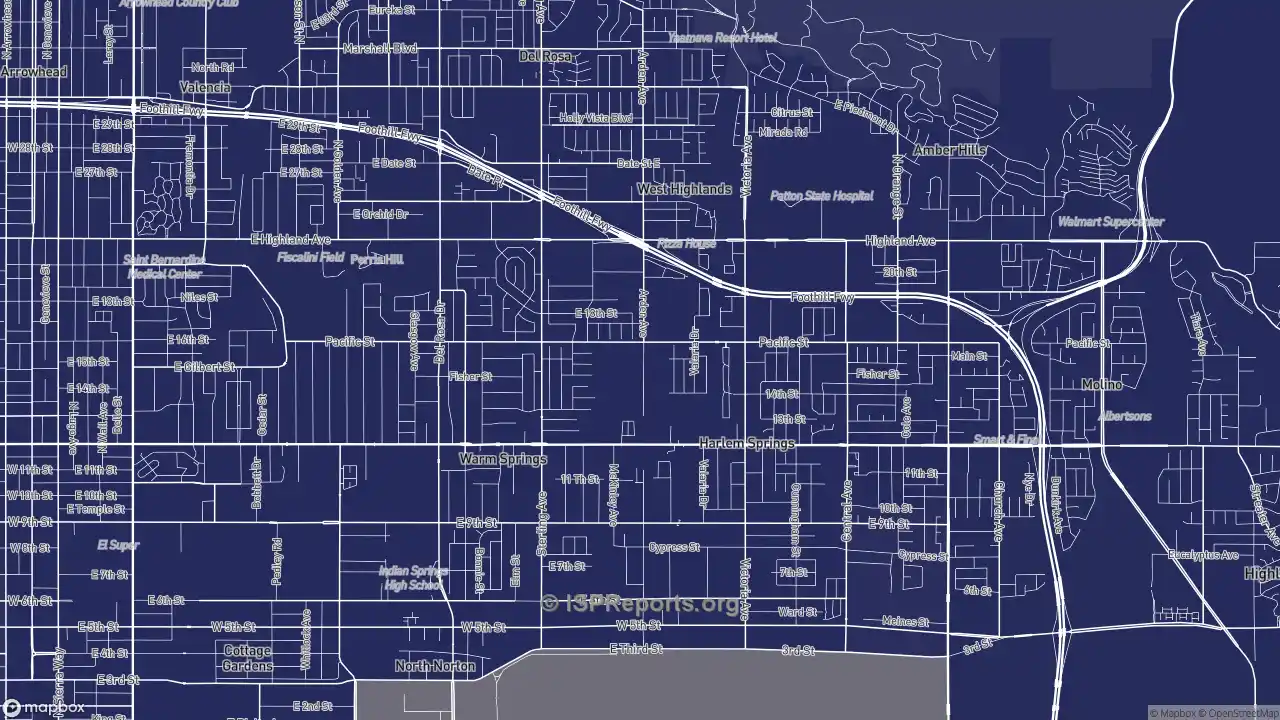
Internet Availability Key
Speeds and coverage vary within the neighborhood, and sometimes even from block to block. The map shows speeds per provider and where each provider is available.
Who is the Fastest Internet Provider in San Gorgonio?
Based on both FCC data and unbiased customer ratings in San Gorgonio, the fastest internet in the neighborhood comes from Frontier Communications.
Data Reported to FCC by ISPs: Average Maximum Available in San Gorgonio
| ISP / Tech Type | Max Advertised Speed | ||
|---|---|---|---|
| Frontier Communications | 7,000 Mbps | ||
| AT&T | 1,000 Mbps | ||
| EarthLink | 1,000 Mbps | ||
| Spectrum | 1,000 Mbps | ||
| Verizon | 300 Mbps | ||
| T-Mobile Home Internet | 100 Mbps | ||
| Viasat | 100 Mbps | ||
| HughesNet | 25 Mbps |
Customer Ratings for Internet Provider Speeds in San Gorgonio
| ISP / Tech Type | San Gorgonio Speed | California Speed | National Speed | For Service | ||
|---|---|---|---|---|---|---|
| Frontier | (1) | (42) | (143) | View Plans | ||
| Spectrum | (1) | (203) | (1738) | View Plans | ||
| Verizon | (0) | (24) | (723) | View Plans | ||
| T-Mobile Home Internet | (0) | (22) | (284) | View Plans | ||
| AT&T | (0) | (107) | (924) | View Plans | ||
| HughesNet | (0) | (1) | (18) | View Plans | ||
| Viasat | (0) |  (1) (1) |  (11) (11) | View Plans | ||
| EarthLink | (0) | (2) | (12) | View Plans |
Based on data reported by San Gorgonio ISPs to the FCC, the fastest speeds in the neighborhood are available through Frontier Communications. The company offers speeds up to 7,000 Mbps in San Gorgonio. Therefore, the average customer can get up to 7,000 Mbps if they're willing to purchase the fastest subscription tier available at their homes.
However, actual customers in the neighborhood rated their satisfaction with internet speed highest with Frontier Communications. This indicates Frontier reliably delivers speeds expected by the customer based on the plan they are paying for.
Who is the Cheapest Internet Provider in San Gorgonio?
Highland customers rate T-Mobile Home Internet as the cheapest internet service provider in city. Data comes from customers in the city rating their satisfaction with pricing. This feedback is valuable because it considers price changes and whether the speeds paid for are worth it.
T-Mobile Home Internet received a local rating of 4.11 out of 5, which is higher than the average across all internet providers in the country. Verizon is rated in second place for affordability by the company’s San Gorgonio customers with an average price rating of 3.91 out of 5.
The chart and graph below show how customers in San Gorgonio, Highland, and the United States rated the affordability of their internet service.
Rated Affordability in San Gorgonio
| ISP / Tech Type | San Gorgonio Affordability | California Affordability | National Affordability | For Service | ||
|---|---|---|---|---|---|---|
| Frontier | (1) | (42) | (143) | View Plans | ||
| Spectrum | (1) | (203) | (1738) | View Plans | ||
| T-Mobile Home Internet | (0) | (22) | (284) | View Plans | ||
| Verizon | (0) | (24) | (723) | View Plans | ||
| AT&T | (0) | (107) | (924) | View Plans | ||
| HughesNet | (0) | (1) | (18) | View Plans | ||
| Viasat | (0) | (1) | (11) | View Plans | ||
| EarthLink | (0) | (2) | (12) | View Plans |
San Gorgonio Internet Health Assessment
ISP Reports evaluates the technological infrastructure across the United States. This includes assessing a grade for ISP providers and infrastructure in the neighborhood and setting an index number for the digital connectivity of its residents. You can view the ISP Report Card and the Digital Connectivity Index for San Gorgonio below, including the metrics used and how San Gorgonio compares to the rest of Highland and nation.
| Metric
(hover for details)
|
San Gorgonio | California | USA | ||
|---|---|---|---|---|---|
| Fiber Availability Percent The percentage of households in San Gorgonio that have a Fiber internet connection available to their home. | 9.60% | 26.21% | 67.25% | ||
| Average Download SpeedThe maximum download speed most households can get on average. This is measured by availability in a block group and weighted by the population in that area. | 1,289 Mbps | 2,180 Mbps | 3,293 Mbps | ||
| Provider CountThe number of providers available for most people. This is a weighted average by block rather than a total for San Gorgonio. | 6.6 | 6.6 | 6.8 |
| Average Household SizeA larger household size in a neighborhood indicates that there will be a greater need for bandwidth due to simultaneous usage, multiple devices, and network congestion. | 3.3 | 3.4 | 2.7 | ||
| Work From Home PercentA higher percent of the population working from home indicates bandwidth requirements being more widely needed rather than consolidated to commercial portions of the city. | 5% | 8% | 14% | ||
| Households with DevicesA higher percentage of households with computing devices in the home indicates a higher level of infrastructure needed to support those households. | 97% | 96% | 95% | ||
| Households with InternetA higher percentage of households with internet indicates a higher need for usage and connectivity in people’s daily lives. | 90% | 90% | 90% | ||
| Households with BroadbandA higher percentage of households with a broadband connection (defined as speeds above 25 Mbps) indicates heavier usage needs within these households. | 68% | 73% | 75% | ||
| Broadband Usage vs. AvailabilityThis measures what percentage of households who have a broadband connection to their home actually have an active subscription to that service. | 68% | 73% | 76% |
Our demographic data is sourced from the latest 5-year release of the American Community Survey by the US Census Bureau.
San Gorgonio ISP Report Card & Digital Connectivity Index
The ISP Report Card in San Gorgonio is C+, which is comparable to other neighborhoods. The local demand for broadband internet connectivity in San Gorgonio is high with a score of 62 / 100 in our Digital Connectivity Index. This means that internet service providers operating in San Gorgonio have done a good job meeting the needs of its residents.
The San Gorgonio ISP Report Card evaluates the neighborhood on availability and speed metrics compared to other neighborhoods in the United States. ISP Infrastructure can vary greatly and on its own isn’t a perfect measure of what a neighborhood needs. Please see our ISP Report Card along with the Digital Connectivity Index above to evaluate how well the connectivity demand is met by the existing infrastructure.
90% of San Gorgonio households have an internet connection despite having 99.93% availability. 68% of households have fiber, cable, or DSL, 12% have satellite, 0% are still on dial-up, and 4% of households have internet but don’t pay for a subscription because it’s subsidized by the Affordable Connectivity Program.
As you can see in the table above, while 68% of households have a broadband connection such as fiber, cable or DSL available to their home, 68% subscribe to it. A moderate amount of San Gorgonio residents are taking advantage of the available internet infrastructure.
For more details, please visit our ISP Report Card and Digital Connectivity Index pages.
How do Neighboring Neighborhoods Compare to San Gorgonio?
- ISP Report Card: C+
- Digital Connectivity Index: 52 / 100
- ISP Report Card: A-
- Digital Connectivity Index: 53 / 100
- ISP Report Card: B
- Digital Connectivity Index: 48 / 100
- ISP Report Card: C+
- Digital Connectivity Index: 62 / 100
- ISP Report Card: B
- Digital Connectivity Index: 59 / 100
- ISP Report Card: B+
- Digital Connectivity Index: 61 / 100
- ISP Report Card: B
- Digital Connectivity Index: 83 / 100
- ISP Report Card: B
- Digital Connectivity Index: 69 / 100
- ISP Report Card: C+
- Digital Connectivity Index: 61 / 100
How Much Speed does a San Gorgonio Household Need?
Higher speed is typically preferred, but that comes at a higher price. The average size of a household in San Gorgonio is 3.3, which is smaller than the Highland average of 3.4 and larger than the national average of 2.7. San Gorgonio's average household income is $60,120 which is much lower than the Highland average of $93,262 and lower than the national average of $90,606. Homes with more people living in them and with lower incomes tend to indicate a fairly average device usage pattern.
San Gorgonio also has 15% of its population enrolled in school between the 6th grade and college level, this is lower than the Highland average of 17%. Additionally, 5% of residents work from home, which is lower than the 8% of residents in Highland who work from home. This and other factors you can see above show us that the community of San Gorgonio has a high need for internet connectivity and speeds.
Compared to the rest of the country, San Gorgonio households are more technology-engaged. 97% of households have some sort of computing device, 73% have desktops or laptops in the home, and 96% have smartphones. To see what speeds you are currently getting, please visit our internet speed test tool.
Which Fiber Internet Providers are Available in San Gorgonio?
Frontier Fiber in San Gorgonio, Highland, CA
Availability:
4.8%
Customer Rating:
(110)
Avg. Download Speed
7,000 Mbps
Frontier Communications offers Fiber service to 4.8% of San Gorgonio homes. Across the neighborhood, Frontier Fiber is the only type of service available from the company, with speeds up to 7,000 Mbps
EarthLink Fiber in San Gorgonio, Highland, CA
Availability:
4.8%
Customer Rating:
(5)
Avg. Download Speed
1,000 Mbps
EarthLink offers Fiber service to 4.8% of San Gorgonio homes. Across the neighborhood, EarthLink Fiber has speeds up to 1,000 Mbps
AT&T Fiber in San Gorgonio, Highland, CA
Availability:
4.8%
Customer Rating:
(544)
Avg. Download Speed
1,000 Mbps
AT&T offers Fiber service to 4.8% of San Gorgonio homes. Across the neighborhood, AT&T Fiber has speeds up to 1,000 Mbps
Which Cable Internet Providers are Available in San Gorgonio?
Spectrum Cable in San Gorgonio, Highland, CA
Availability:
99.9%
Customer Rating:
(1,618)
Avg. Download Speed
1,000 Mbps
Spectrum offers Cable service to 99.9% of San Gorgonio homes. Across the neighborhood, Spectrum Cable is the only type of service available from the company, with speeds up to 1,000 Mbps
Which DSL Internet Providers are Available in San Gorgonio?
EarthLink DSL in San Gorgonio, Highland, CA
Availability:
98.7%
Customer Rating:
(4)
Avg. Download Speed
66 Mbps
EarthLink offers DSL service to 98.7% of San Gorgonio homes. Across the neighborhood, EarthLink DSL has speeds up to 66 Mbps, with speeds from 10 Mpbs up to 100 Mbps depending on the address. Upload speeds differ from download speeds, and are as low 1.0 and as high as 20, with an average of 13 Mbps throughout the neighborhood. EarthLink DSL is rated the same as other types of internet service available in San Gorgonio from EarthLink in terms of customer satisfaction.
AT&T DSL in San Gorgonio, Highland, CA
Availability:
98.7%
Customer Rating:
(304)
Avg. Download Speed
66 Mbps
AT&T offers DSL service to 98.7% of San Gorgonio homes. Across the neighborhood, AT&T DSL has speeds up to 66 Mbps, with speeds from 10 Mpbs up to 100 Mbps depending on the address. Upload speeds differ from download speeds, and are as low 1.0 and as high as 20, with an average of 13 Mbps throughout the neighborhood. AT&T DSL is rated about the same as other types of internet service available in San Gorgonio from AT&T in terms of customer satisfaction.
Which Fixed Wireless and LTE Internet Providers are Available in San Gorgonio?
T-Mobile Home Internet Fixed Wireless in San Gorgonio, Highland, CA
Availability:
99.9%
Customer Rating:
(0)
Avg. Download Speed
28 Mbps
T-Mobile Home Internet offers Fixed Wireless service to 99.9% of San Gorgonio homes. Across the neighborhood, T-Mobile Home Internet Fixed Wireless is the only type of service available from the company, with speeds up to 28 Mbps, with speeds from 25 Mpbs up to 100 Mbps depending on the address. Upload speeds differ from download speeds, and are as low 3.0 and as high as 20, with an average of 3.8 Mbps throughout the neighborhood.
Verizon Fixed Wireless in San Gorgonio, Highland, CA
Availability:
94.2%
Customer Rating:
(0)
Avg. Download Speed
300 Mbps
Verizon offers Fixed Wireless service to 94.2% of San Gorgonio homes. Across the neighborhood, Verizon Fixed Wireless is the only type of service available from the company, with speeds up to 300 Mbps
EarthLink Fixed Wireless in San Gorgonio, Highland, CA
Availability:
79.3%
Customer Rating:
(0)
Avg. Download Speed
48 Mbps
EarthLink offers Fixed Wireless service to 79.3% of San Gorgonio homes. Across the neighborhood, EarthLink Fixed Wireless has speeds up to 48 Mbps, with speeds from 25 Mpbs up to 100 Mbps depending on the address. Upload speeds differ from download speeds, and are as low 3.0 and as high as 20, with an average of 8.1 Mbps throughout the neighborhood.
AT&T Fixed Wireless in San Gorgonio, Highland, CA
Availability:
79.3%
Customer Rating:
(0)
Avg. Download Speed
48 Mbps
AT&T offers Fixed Wireless service to 79.3% of San Gorgonio homes. Across the neighborhood, AT&T Fixed Wireless has speeds up to 48 Mbps, with speeds from 25 Mpbs up to 100 Mbps depending on the address. Upload speeds differ from download speeds, and are as low 3.0 and as high as 20, with an average of 8.1 Mbps throughout the neighborhood.
Which ISP Should You Choose in San Gorgonio?
The right ISP for you depends upon your needs, but in general we can make the following suggestions:
- The best all-around internet service provider in San Gorgonio is Frontier.
- The fastest internet provider should be Frontier Communications. Considering speed for the money and reliability in speeds, Frontier Communications may be a better choice based on real-world local customer feedback.
- The most affordable internet provider in San Gorgonio is T-Mobile Home Internet.
- HughesNet, AT&T, EarthLink, Spectrum, T-Mobile Home Internet, and Viasat has the broadest coverage in San Gorgonio, and is most likely to cover your home. To find out exactly what's available at your home, please use our address search tool.
How does San Gorgonio compare to other cities with a similar population?
To see how San Gorgonio stacks up on the national level, it's useful to look at some other cities with similarly sized populations. Below you can see a list of these cities and how they compare to San Gorgonio's C+ ISP Report Card and 62 / 100 Digital Connectivity Index.
- ISP Report Card: A
- Digital Connectivity Index: 54 / 100
- ISP Report Card: C+
- Digital Connectivity Index: 84 / 100
- ISP Report Card: A-
- Digital Connectivity Index: 87 / 100
- ISP Report Card: A-
- Digital Connectivity Index: 86 / 100
- ISP Report Card: B+
- Digital Connectivity Index: 68 / 100
- ISP Report Card: C+
- Digital Connectivity Index: 44 / 100
- ISP Report Card: B+
- Digital Connectivity Index: 41 / 100
- ISP Report Card: B
- Digital Connectivity Index: 49 / 100
- ISP Report Card: B+
- Digital Connectivity Index: 82 / 100
Customer Reviews
Customer Reviews for Internet Service Providers in California
Customer Reviews
Dave B
Frontier Fiber
 January 22, 2026
 Frontier has been very good and the speed is very fast. We had a connection problem at first but they came out and got everything working very quickly. Over all I am very happy with Frontier internet.
More
A Lincoln, CA Customer
AT&T Fiber
January 22, 2026 AT&T has been very good to us. Although their prices can be expensive, the internet is always fast and reliable. We have been getting gig speed and hope to continue with the company. Internet is important in my life so having fast internet is enjoyable. If you are willing to pay, I would recommend AT&T Fiber.
More
A Walnut Creek, CA Customer
Astound Broadband Cable
January 18, 2026 Overall, I am satisfied with the service. The download speed is fast (1Gbps), and the pricing is fair. The install process and setup was straightforward. However, the biggest downside by far is that the upload speed is much slower than the download speed.
More
A Camp Pendleton North, CA Customer
Cox Cable
January 16, 2026 More
Kendall S.
unWired Broadband Fixed Wireless
January 15, 2026 Great customer service. I live in a very rural area and internet services are limited. When I first moved to my current residence I was an existing AT&T customer. To keep things simple I transferred my services. After one year of very slow unreliable service via the phone line I switched to fixed WiFi with unwired. Not only did the internet service improve but the cost decreased. They treat their clients well. When I called in to lower my internet’s speed because I couldn’t afford the current plan they acknowledged that I was a long time customer and decreased my monthly bill but also increased my speed. When their service tech were on site they are polite and respectful. Unwired broadband is a great company to work with.
More
Rate your provider
Share your experience to help others in your area choose.
Verified customer: we detected your connection is on this provider.
Don't see your provider? Search all providers
Reviews are independent and unedited. Published after a quick spam check.