Mid-States Services Business Internet Availability
Mid-States Services business internet availability by address. Enter a zip code, city, or address below to see all providers.
Mid-States Services business internet availability by address. Enter a zip code, city, or address below to see all providers.
Mid-States Services has business internet service available to less than 1% of people in the US. Among those covered, the breakdown by service type is as follows:
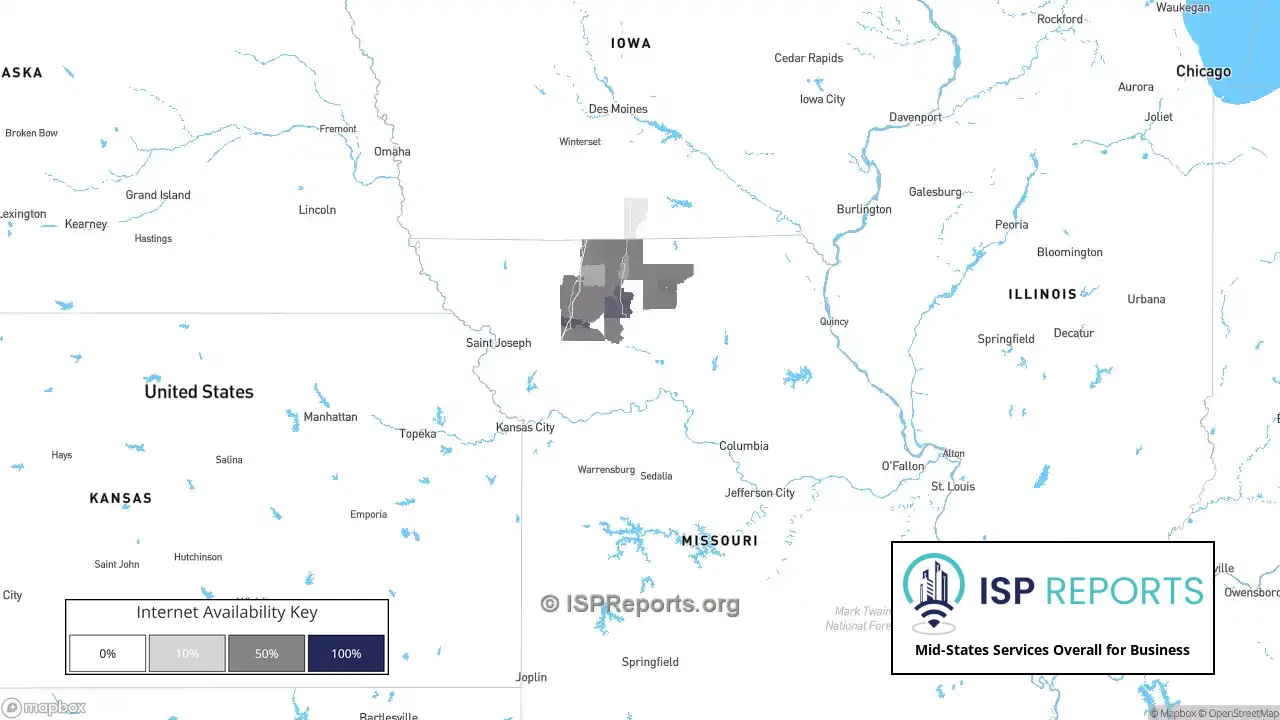
This map illustrates Mid-States Services’s business internet availability across the United States. Use the buttons at the top of the map to toggle between the different types of connections including fiber and fixed wireless.
For more detailed comparisons and interactive maps, visit our Internet Service Providers Near You page. Alternatively, you can search by address on our Internet Service Providers by Address page, or use the search feature at the top of this page.
This page reflects the most recent FCC update from January 06, 2026, based on the Broadband Data Collection as of June 30, 2025.
This map highlights Mid-States Services coverage and speeds by state, Mid-States Services has the biggest presence in Missouri and Iowa. Hover over each state to see Mid-States Services availability by connection type, and click on a state to see all providers in that state.
Mid-States Services frequently competes for business customers with providers like T-Mobile Home Internet, Optimum, and EarthLink. Below, we offer a side-by-side comparison of these ISPs based on key metrics such as service availability, average speeds, and customer ratings.
| Mid-States Services vs T-Mobile Home Internet | |
|---|---|
| 91.66% Availability Overlap | |
| National Availability | |
| less than 1% | 85.87% |
| High Speed Availability | |
| 73.32% Fiber | 100.00% Fixed Wireless |
| Average Speed | |
| 960 Mbps | 60 Mbps |
| Customer Rating | |
 (1) (1) |  (284) (284) |
| Mid-States Services vs Optimum | |
|---|---|
| 41.83% Availability Overlap | |
| National Availability | |
| less than 1% | 3.64% |
| High Speed Availability | |
| 73.32% Fiber | 100.00% Cable |
| Average Speed | |
| 960 Mbps | 505 Mbps |
| Customer Rating | |
| (1) |  (246) (246) |
| Mid-States Services vs AT&T | |
|---|---|
| 38.06% Availability Overlap | |
| National Availability | |
| less than 1% | 73.09% |
| High Speed Availability | |
| 73.32% Fiber | 40.47% Fixed Wireless |
| Average Speed | |
| 960 Mbps | 17 Mbps |
| Customer Rating | |
| (1) |  (924) (924) |
Mid-States Services competes with 13 other ISPs across the U.S., defined as any provider that competes in at least some part of Mid-States Services's service area. On average, customers within Mid-States Services's service area have about 3.2 alternative ISP options to choose from.
Mid-States Services is available in 22 cities throughout the country. Here is a list of the largest cities with Mid-States Services business internet service: