
Best Internet Providers in Suffolk County, NY
All 4 providers, ranked by coverage, speed and customer ratings
Find internet availability by address in Suffolk County, NY
Suffolk County has 4 internet service providers, they are sorted by coverage, available speed, and customer rating from our unbiased internet provider report. Fiber, Cable, Fixed Wireless, and DSL internet are available in the county. Reviews are grouped by provider and the type of service they offer, covering all 4 available internet technologies in Suffolk County.
Ranks compare Suffolk County with the 62 New York counties.
The Best Internet in Suffolk County, NY at a Glance
Suffolk County Internet Providers, Ranked by Coverage, Speed and Customer Ratings
Optimum
Connection

Customer Rating
Fiber

Cable

EarthLink
Connection
Customer Rating
Fiber
Verizon
Connection
Customer Rating
Fiber

Fixed Wireless


Providers with less than 1% coverage in this county are excluded from the list. To see if one of these providers is available at your home, please use the address search above.
Speed and technology may vary by address for all providers. Please note we may have a financial relationship with some of the providers above, which does not impact the customer ratings displayed. Customer ratings listed above are national ratings, local Suffolk County ratings may vary and are shown below.
Who is the Best Internet Provider in Suffolk County, NY?
EarthLink is the highest-rated internet provider in Suffolk County based on 254 New York customer reviews, and T-Mobile Home Internet has the highest rating nationwide. The provider information above and the information immediately below can help you decide. Compare provider ratings and review counts above.

or call 1-877-418-2092
Which Providers are Available at my Home in Suffolk County?
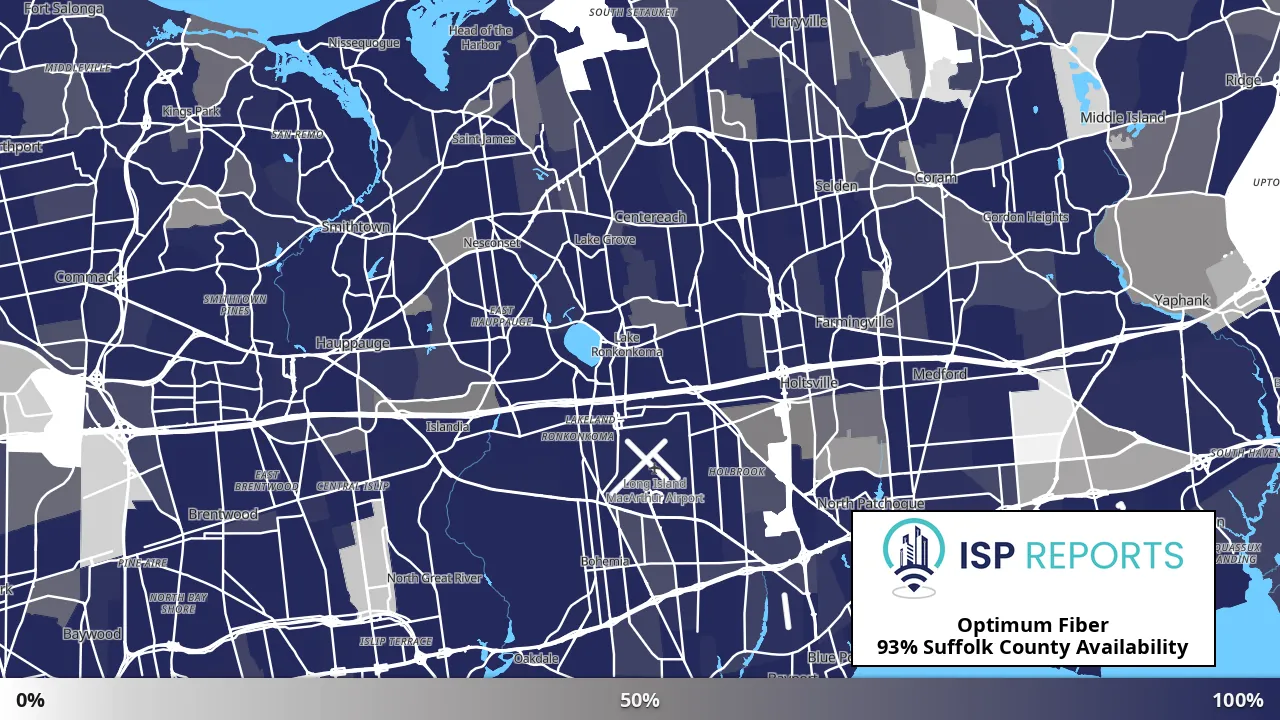
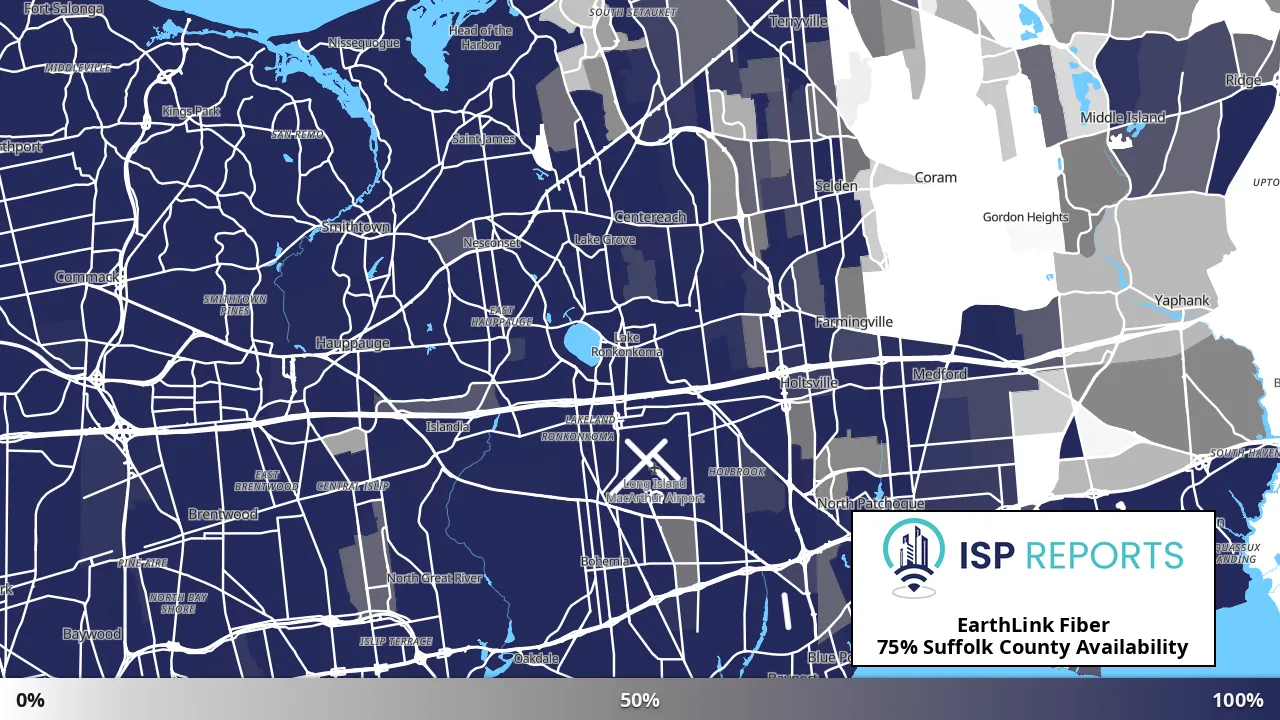
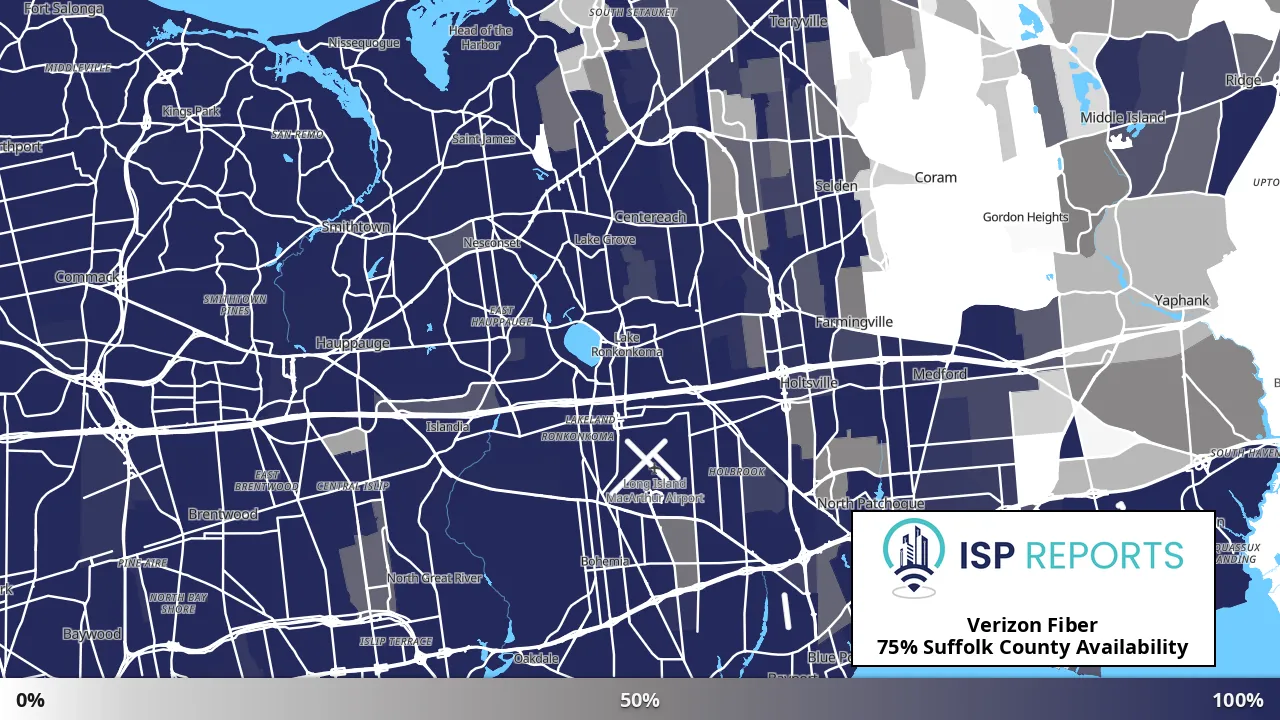
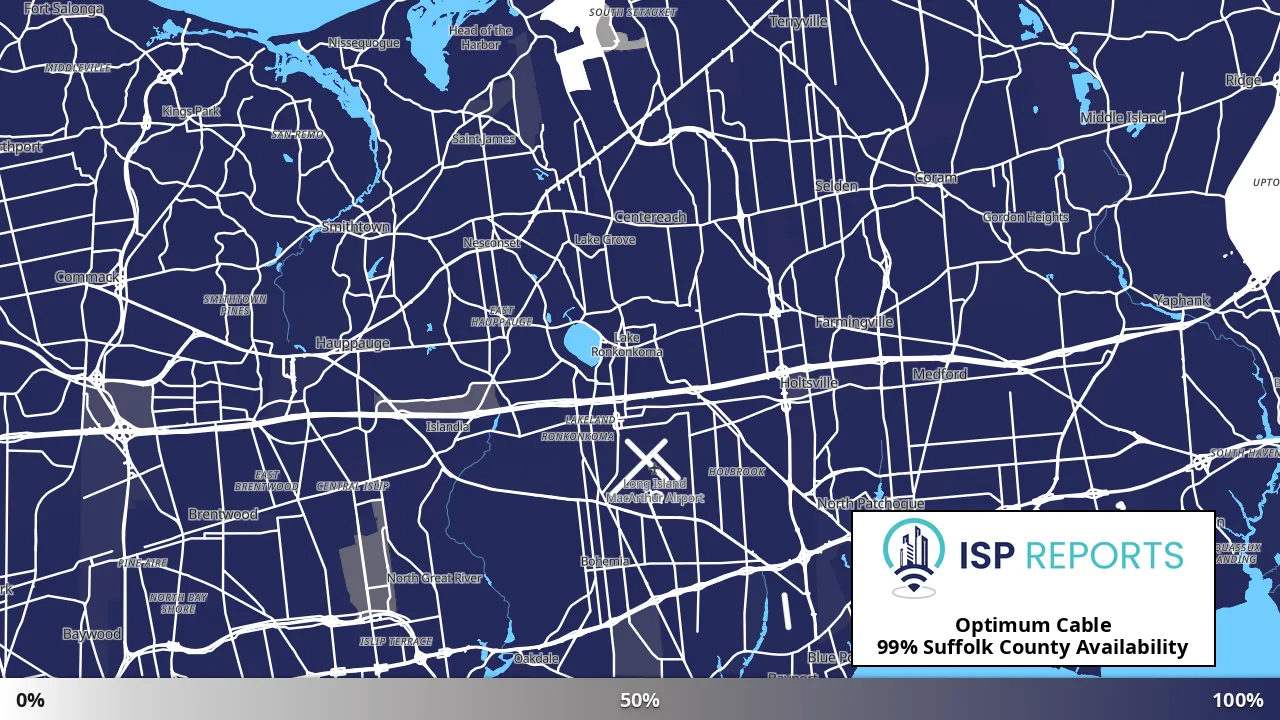
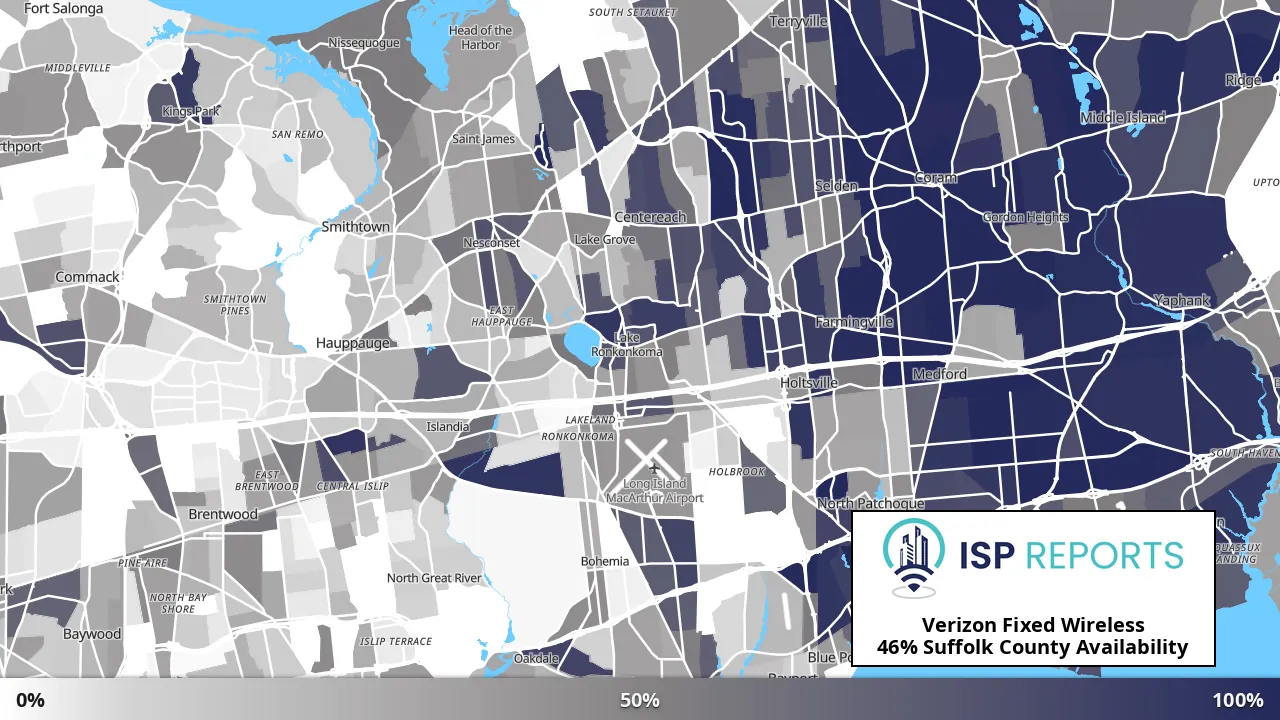
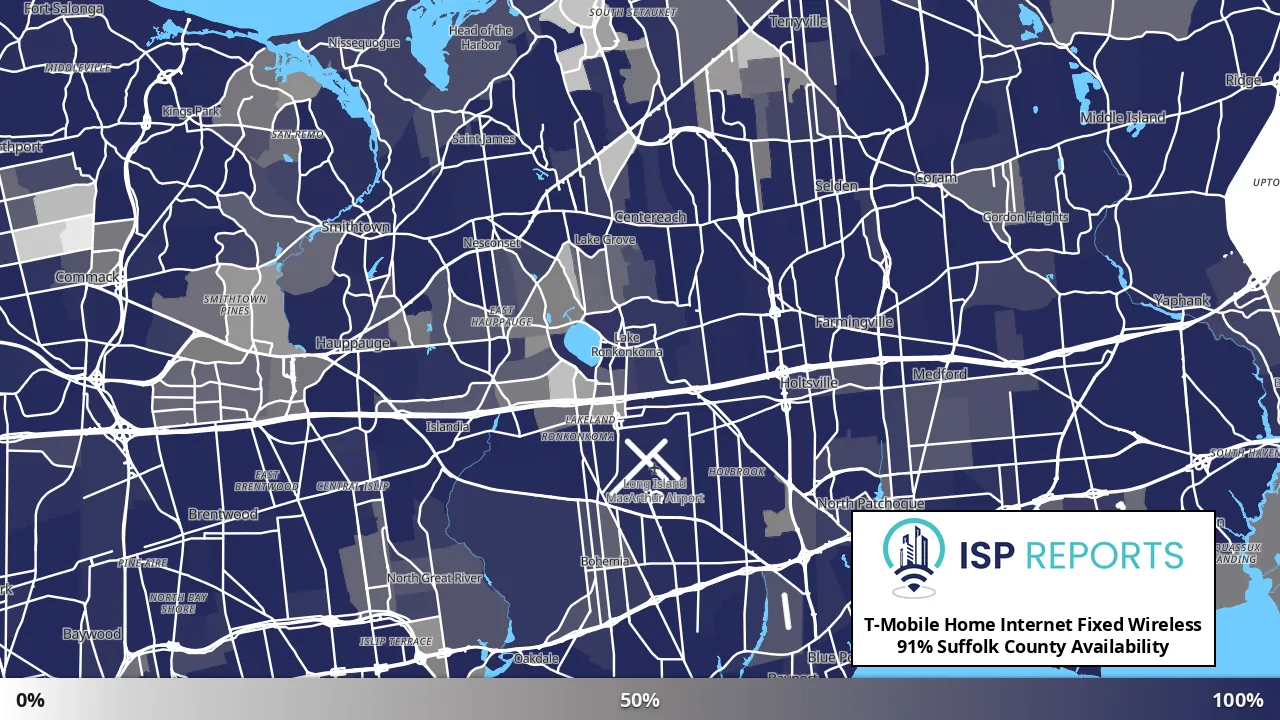
Coverage changes block by block. Pick a provider and a technology to see where its service reaches: the darker the area, the larger the share of homes it covers. For your exact address, use the address search above.
How Suffolk County Compares to the Rest of New York
Suffolk County's report card score is 7th of 62 and its connectivity index is tied 2nd of 62.
| Measure | Suffolk County | Rank among New York counties | New York | US | Leader |
|---|---|---|---|---|---|
| ISP Report Card inputs: what providers offer here | |||||
| Fiber availability | 96.0% | 8th of 62 | 86.4% | 71.5% | Richmond County (99.5%) |
| Average top speed | 7,563 Mbps | 2nd of 62 | 4,235 Mbps | 3,486 Mbps | Nassau County (7,817 Mbps) |
| Providers at a typical address | 4.8 | Tied 11th of 62 | 5.2 | 7.1 | New York County (7) |
| Connectivity index inputs: how much households need and use the internet | |||||
| People per household | 3.0 | Tied 4th of 62 | 2.6 | 2.7 | Rockland County (3.5) |
| Workers who work from home | 13% | Tied 21st of 62 | 15% | 15% | New York County (25%) |
| Homes with a computer, tablet or phone | 97% | Tied 1st of 62 | 95% | 96% | Tied with Dutchess County and Nassau County and 3 more |
| Homes with internet | 94% | Tied 3rd of 62 | 91% | 91% | Nassau County and Putnam County (95%) |
| Homes on fiber, cable or DSL | 83% | Tied 3rd of 62 | 77% | 76% | Nassau County and Saratoga County (84%) |
| More about the households here | |||||
| Homes with a desktop or laptop | 87% | Tied 3rd of 62 | 80% | 81% | Tompkins County (89%) |
| Median household income | $138,438 | 3rd of 62 | $100,975 | $93,246 | Nassau County ($156,303) |
| Residents in school (6th grade to college) | 16% | Tied 14th of 62 | 16% | 16% | Tompkins County (33%) |
Fiber reaches 96.0% of homes in Suffolk County, against 86.4% across New York. Households in Suffolk County are larger than the US average (3.0 people against 2.7); 13% of workers work from home (US 15%); and the median household income is $138,438 (US $93,246).
Our demographic data is sourced from the latest 5-year release of the American Community Survey by the US Census Bureau.
How Suffolk County Compares to Its Neighbors
Suffolk County has 6 neighbors, 5 of them in Connecticut and Rhode Island. Among them, Nassau County has the most homes with fiber (99.4%) and New London County, CT the fewest (91.4%); Suffolk County has 96.0%.
Map of Suffolk County and its neighbors by ISP Report Card grade
Hover over or tap a county for its numbers, and click through to its page.
Suffolk County and its neighbors
| County | People | Homes with fiber | Average top speed | Providers at a typical address | Report card | Connectivity |
|---|---|---|---|---|---|---|
| Suffolk County (this page) | 1,525,920 | 96.0% | 7,563 Mbps | 4.8 | B | 81/100 |
| Nassau County | 1,395,774 | 99.4% | 7,817 Mbps | 5.2 | B+ | 85/100 |
| Fairfield County, CT | 957,419 | 97.3% | 7,553 Mbps | 7.3 | A- | 80/100 |
| New Haven County, CT | 864,835 | 93.4% | 6,660 Mbps | 6.7 | B+ | 69/100 |
| New London County, CT | 268,555 | 91.4% | 6,567 Mbps | 6.4 | B+ | 66/100 |
| Middlesex County, CT | 164,245 | 92.8% | 6,421 Mbps | 6.2 | B+ | 69/100 |
| Washington County, RI | 129,839 | 93.0% | 1,974 Mbps | 5.6 | B | 74/100 |
Internet in Suffolk County by City and ZIP Code
Fiber reaches from 63.4% of homes in Stony Brook to 100.0% in West Islip; by ZIP code, from 66.7% in 11933 (Calverton) to 100.0% in 11972 (Speonk). Each row links to that place’s page.
Cities and towns in Suffolk County
| City or town | People | Homes with fiber | Average top speed | Providers at a typical address | Report card | Connectivity |
|---|---|---|---|---|---|---|
| Brentwood | 61,568 | 99.9% | 7,944 Mbps | 5.2 | B+ | 79/100 |
| West Babylon | 37,304 | 99.8% | 7,958 Mbps | 5.3 | B+ | 83/100 |
| Bay Shore | 37,119 | 99.4% | 7,797 Mbps | 5.1 | B+ | 78/100 |
| Central Islip | 36,418 | 97.3% | 7,604 Mbps | 5.1 | B+ | 72/100 |
| Huntington | 35,226 | 100.0% | 7,966 Mbps | 5 | B+ | 88/100 |
| Huntington Station | 35,012 | 100.0% | 7,952 Mbps | 5.2 | B+ | 75/100 |
| Lindenhurst | 33,869 | 99.9% | 7,991 Mbps | 5.3 | A- | 84/100 |
| Coram | 32,000 | 75.0% | 6,227 Mbps | 3.7 | C+ | 65/100 |
| Riverhead | 30,399 | 93.8% | 7,552 Mbps | 3.7 | B- | 56/100 |
| East Northport | 30,092 | 100.0% | 7,915 Mbps | 5 | B+ | 86/100 |
| Smithtown | 28,921 | 99.0% | 7,759 Mbps | 5 | B+ | 86/100 |
| Deer Park | 28,837 | 100.0% | 7,944 Mbps | 5.2 | B+ | 75/100 |
| Centereach | 28,419 | 95.6% | 7,691 Mbps | 5.3 | B+ | 87/100 |
| Medford | 27,102 | 85.4% | 6,886 Mbps | 4.7 | B- | 72/100 |
| Commack | 27,021 | 99.8% | 7,612 Mbps | 5 | B+ | 89/100 |
| Dix Hills | 26,323 | 99.9% | 5,805 Mbps | 4.9 | B+ | 91/100 |
| Holbrook | 26,309 | 98.8% | 7,008 Mbps | 4.9 | B+ | 84/100 |
| West Islip | 25,715 | 100.0% | 7,996 Mbps | 5.1 | B+ | 89/100 |
| Shirley | 25,640 | 99.2% | 7,956 Mbps | 3.5 | B | 72/100 |
| Selden | 24,981 | 95.4% | 7,672 Mbps | 5.2 | B+ | 84/100 |
| Ronkonkoma | 24,708 | 99.9% | 7,994 Mbps | 5.1 | B+ | 82/100 |
| Hauppauge | 24,148 | 99.7% | 7,521 Mbps | 5 | B+ | 91/100 |
| Stony Brook | 22,693 | 63.4% | 6,793 Mbps | 4.6 | C+ | 84/100 |
| East Patchogue | 21,338 | 91.7% | 7,336 Mbps | 5.2 | B | 71/100 |
| Copiague | 20,245 | 99.9% | 7,889 Mbps | 5.3 | B+ | 77/100 |
| North Bay Shore | 20,192 | 100.0% | 8,000 Mbps | 5.2 | B+ | 64/100 |
| Melville | 19,929 | 96.7% | 6,211 Mbps | 4.9 | B | 86/100 |
| North Babylon | 18,919 | 99.9% | 7,940 Mbps | 5.2 | B+ | 78/100 |
| Kings Park | 18,076 | 99.7% | 7,509 Mbps | 5 | B+ | 79/100 |
| Farmingville | 17,638 | 96.0% | 7,651 Mbps | 5.1 | B | 84/100 |
| Wyandanch | 17,514 | 99.7% | 7,916 Mbps | 5.3 | B+ | 76/100 |
| North Amityville | 17,309 | 100.0% | 7,840 Mbps | 5.5 | A- | 82/100 |
| Sayville | 16,722 | 99.3% | 7,752 Mbps | 5.2 | B+ | 77/100 |
| Mastic | 15,521 | 99.0% | 7,934 Mbps | 4 | B | 82/100 |
| Hampton Bays | 15,036 | 99.1% | 7,980 Mbps | 3.8 | B | 68/100 |
| Setauket-East Setauket | 14,919 | 95.4% | 7,493 Mbps | 5.2 | B | 90/100 |
| Islip | 14,901 | 99.8% | 7,838 Mbps | 5.2 | B+ | 65/100 |
| Mastic Beach | 14,716 | 99.3% | 7,951 Mbps | 3.9 | B | 81/100 |
| East Islip | 14,678 | 100.0% | 7,982 Mbps | 4.9 | B+ | 77/100 |
| Nesconset | 14,553 | 100.0% | 7,801 Mbps | 5.1 | B+ | 87/100 |
| Lake Ronkonkoma | 14,433 | 99.2% | 7,795 Mbps | 5.3 | B+ | 74/100 |
| Manorville | 14,228 | 81.1% | 6,675 Mbps | 3.7 | B- | 81/100 |
| Ridge | 14,155 | 84.4% | 6,822 Mbps | 4.4 | B- | 66/100 |
| Rocky Point | 14,041 | 93.9% | 7,475 Mbps | 4.4 | B | 81/100 |
| Babylon | 13,457 | 100.0% | 7,938 Mbps | 5.7 | A- | 87/100 |
| Port Jefferson Station | 13,352 | 93.0% | 7,302 Mbps | 4.9 | B | 81/100 |
| Patchogue | 12,862 | 99.3% | 7,937 Mbps | 5.7 | A- | 69/100 |
| St. James | 12,592 | 99.9% | 7,434 Mbps | 5.1 | B+ | 80/100 |
| North Bellport | 12,179 | 81.5% | 5,998 Mbps | 4.8 | B- | 65/100 |
| Holtsville | 12,162 | 83.5% | 6,215 Mbps | 5 | B- | 85/100 |
| North Lindenhurst | 12,000 | 99.8% | 7,992 Mbps | 5.2 | B+ | 72/100 |
| Lake Grove | 11,966 | 98.7% | 7,625 Mbps | 5 | B+ | 88/100 |
| Middle Island | 11,965 | 76.8% | 6,234 Mbps | 4.4 | B- | 62/100 |
| Miller Place | 11,723 | 90.4% | 7,321 Mbps | 4.1 | B- | 93/100 |
| Mount Sinai | 11,623 | 72.8% | 5,842 Mbps | 4.3 | C+ | 86/100 |
| Amityville | 11,499 | 100.0% | 7,951 Mbps | 5.5 | A- | 71/100 |
| Northport | 11,079 | 100.0% | 7,800 Mbps | 5.1 | B+ | 85/100 |
| Terryville | 10,420 | 97.6% | 7,514 Mbps | 5 | B+ | 72/100 |
| Greenlawn | 9,963 | 99.9% | 7,829 Mbps | 4.8 | B+ | 82/100 |
| Fort Salonga | 9,877 | 100.0% | 7,676 Mbps | 5.1 | B+ | 86/100 |
| South Huntington | 9,595 | 99.7% | 8,000 Mbps | 5.2 | B+ | 76/100 |
| Bohemia | 9,195 | 100.0% | 7,821 Mbps | 5 | B+ | 74/100 |
| Southampton | 9,023 | 93.7% | 7,684 Mbps | 3.7 | B- | 37/100 |
| Oakdale | 8,787 | 99.8% | 7,978 Mbps | 5.4 | B+ | 73/100 |
| Wading River | 8,656 | 90.3% | 6,984 Mbps | 4.7 | B | 90/100 |
| Bayport | 8,609 | 98.7% | 7,838 Mbps | 5.1 | B+ | 72/100 |
| Center Moriches | 7,983 | 98.8% | 7,929 Mbps | 3.7 | B | 87/100 |
| Springs | 7,973 | 98.8% | 7,919 Mbps | 3.5 | B | 77/100 |
| Port Jefferson | 7,962 | 95.8% | 7,667 Mbps | 5.5 | B+ | 80/100 |
| Baywood | 7,726 | 99.7% | 7,942 Mbps | 5.2 | B+ | 70/100 |
| Sound Beach | 7,416 | 100.0% | 7,996 Mbps | 4.4 | B+ | 75/100 |
| North Patchogue | 7,326 | 99.6% | 7,987 Mbps | 5.4 | B+ | 81/100 |
| Calverton | 6,792 | 66.4% | 5,688 Mbps | 3.3 | C+ | 67/100 |
| Islip Terrace | 6,404 | 100.0% | 8,000 Mbps | 4.9 | B+ | 71/100 |
| East Farmingdale | 6,334 | 99.8% | 7,520 Mbps | 5.2 | B+ | 86/100 |
| East Moriches | 5,946 | 92.0% | 7,436 Mbps | 3.8 | B- | 79/100 |
| East Quogue | 5,871 | 92.0% | 7,433 Mbps | 3.8 | B- | 65/100 |
| Southold | 5,808 | 96.6% | 7,810 Mbps | 3.1 | B- | 77/100 |
| Shoreham | 5,627 | 91.1% | 7,047 Mbps | 4.9 | B | 94/100 |
| Yaphank | 5,570 | 69.6% | 5,820 Mbps | 4.1 | C+ | 64/100 |
| Centerport | 5,529 | 100.0% | 7,876 Mbps | 5.1 | B+ | 91/100 |
| North Sea | 5,463 | 98.9% | 7,924 Mbps | 3 | B | 68/100 |
| East Hampton North | 5,337 | 95.4% | 7,672 Mbps | 3.8 | B | 79/100 |
| Blue Point | 4,855 | 94.7% | 7,619 Mbps | 5.2 | B | 81/100 |
| Greenport | 4,799 | 95.2% | 7,764 Mbps | 3.9 | B | 66/100 |
| Northwest Harbor | 4,637 | 90.8% | 7,365 Mbps | 3.3 | B- | 86/100 |
| Mattituck | 4,589 | 99.7% | 7,990 Mbps | 3.9 | B | 79/100 |
| Noyack | 4,325 | 98.0% | 7,871 Mbps | 3.7 | B | 70/100 |
| Montauk | 4,074 | 95.9% | 7,717 Mbps | 3.7 | B | 77/100 |
| North Great River | 3,850 | 99.8% | 8,000 Mbps | 5 | B+ | 79/100 |
| Westhampton Beach | 3,668 | 98.0% | 7,875 Mbps | 3.9 | B | 81/100 |
| Lloyd Harbor | 3,571 | 99.3% | 7,918 Mbps | 4.9 | B+ | 87/100 |
| Cutchogue | 3,567 | 98.7% | 7,909 Mbps | 3.2 | B | 64/100 |
| Islandia | 3,567 | 93.1% | 7,648 Mbps | 5.4 | B | 71/100 |
| West Sayville | 3,512 | 99.8% | 7,891 Mbps | 5.2 | B+ | 87/100 |
| Eastport | 3,380 | 85.1% | 6,932 Mbps | 3.8 | B- | 79/100 |
| Brookhaven | 3,330 | 100.0% | 7,703 Mbps | 5.6 | A- | 85/100 |
| Moriches | 3,291 | 98.6% | 7,899 Mbps | 3.9 | B | 37/100 |
| Westhampton | 3,265 | 92.5% | 7,464 Mbps | 3.9 | B- | 87/100 |
| Cold Spring Harbor | 3,248 | 99.2% | 7,991 Mbps | 4.7 | B+ | 91/100 |
| Brightwaters | 3,181 | 99.8% | 7,996 Mbps | 5.1 | B+ | 94/100 |
| Sag Harbor | 2,973 | 98.1% | 7,866 Mbps | 3.7 | B | 61/100 |
| Watermill | 2,837 | 96.2% | 7,760 Mbps | 3.8 | B | 81/100 |
| Bellport | 2,162 | 99.3% | 7,951 Mbps | 5.5 | B+ | 74/100 |
| Amagansett | 1,990 | 100.0% | 8,000 Mbps | 3.8 | B | 35/100 |
| Shelter Island | 1,979 | 98.7% | 7,936 Mbps | 3.7 | B | 48/100 |
| Bridgehampton | 1,776 | 100.0% | 8,000 Mbps | 3.7 | B | 59/100 |
| East Hampton | 1,771 | 96.0% | 7,752 Mbps | 3.8 | B | 46/100 |
| Village of the Branch | 1,735 | 100.0% | 7,887 Mbps | 5.2 | B+ | 92/100 |
| East Setauket | 1,728 | 100.0% | 7,984 Mbps | 5.2 | B+ | 90/100 |
| Quogue | 1,662 | 89.3% | 7,248 Mbps | 3.8 | B- | 61/100 |
| Nissequogue | 1,564 | 100.0% | 8,000 Mbps | 5.4 | A- | 93/100 |
| Head of the Harbor | 1,530 | 99.6% | 7,884 Mbps | 5.1 | B+ | 95/100 |
| Huntington Bay | 1,446 | 100.0% | 8,000 Mbps | 4.6 | B+ | 86/100 |
| Great River | 1,416 | 100.0% | 8,000 Mbps | 4.7 | B+ | 58/100 |
| Laurel | 1,253 | 100.0% | 8,000 Mbps | 3.6 | B | 65/100 |
| Sagaponack | 1,248 | 95.3% | 7,666 Mbps | 3.1 | B- | 57/100 |
| Shelter Island Heights | 1,224 | 90.6% | 7,384 Mbps | 4 | B- | 38/100 |
| Peconic | 1,165 | 100.0% | 8,000 Mbps | 3.8 | B | 76/100 |
| North Haven | 1,162 | 99.4% | 7,957 Mbps | 3.4 | B | 79/100 |
| East Marion | 1,048 | 87.1% | 7,091 Mbps | 3.4 | B- | 48/100 |
| Orient | 999 | 97.5% | 7,823 Mbps | 3.7 | B | 57/100 |
| Remsenburg | 986 | 100.0% | 8,000 Mbps | 3.4 | B | 60/100 |
| Wainscott | 912 | 87.2% | 7,094 Mbps | 3.6 | B- | 35/100 |
| Poquott | 903 | 99.0% | 7,207 Mbps | 5.6 | B+ | 92/100 |
| Old Field | 893 | 100.0% | 8,000 Mbps | 4.6 | B+ | 92/100 |
| Speonk | 823 | 100.0% | 8,000 Mbps | 4 | B+ | 69/100 |
| Belle Terre | 808 | 100.0% | 8,000 Mbps | 5.4 | A- | 90/100 |
| Asharoken | 592 | 100.0% | 8,000 Mbps | 5.5 | A- | 89/100 |
| Jamesport | 556 | 100.0% | 8,000 Mbps | 3.9 | B+ | 63/100 |
| Ocean Beach | 448 | 99.8% | 2,300 Mbps | 3.6 | B- | 63/100 |
| Fishers Island | 424 | 88.7% | 446 Mbps | 2.2 | D+ | 51/100 |
| Pine Aire | 404 | 92.3% | 2,300 Mbps | 4 | B- | 81/100 |
| Stony Brook University | 382 | 100.0% | 980 Mbps | 4 | C+ | 78/100 |
| Fire Island | 312 | 93.6% | 2,295 Mbps | 3.4 | C+ | 64/100 |
| Montauk Beach | 244 | 100.0% | 8,000 Mbps | 4 | B+ | 79/100 |
| Oak Beach | 212 | 84.9% | 2,300 Mbps | 5 | B- | 39/100 |
| Shinnecock Hills | 170 | 100.0% | 8,000 Mbps | 4 | B+ | 67/100 |
| Northampton | 168 | 80.4% | 8,000 Mbps | 3.4 | C+ | 84/100 |
| West Hampton Dunes | 126 | 100.0% | 8,000 Mbps | 4 | B+ | 77/100 |
| Saltaire | 113 | 100.0% | 2,300 Mbps | 3.7 | B | 62/100 |
| Napeague | 106 | 81.1% | 6,749 Mbps | 2.7 | C+ | 79/100 |
| West Gilgo Beach | 103 | 100.0% | 255 Mbps | 3 | C | 36/100 |
| Gilgo | 82 | 100.0% | 2,300 Mbps | 5 | B | 36/100 |
| Flanders | 74 | 31.1% | 3,622 Mbps | 1.5 | C- | 72/100 |
| Greenport West | 73 | 97.3% | 8,000 Mbps | 2 | B- | 45/100 |
| Dering Harbor | 50 | 16.0% | 2,070 Mbps | 2.8 | D+ | 45/100 |
ZIP codes in Suffolk County
| ZIP code | People | Homes with fiber | Average top speed | Providers at a typical address | Report card | Connectivity |
|---|---|---|---|---|---|---|
| 11746 (Huntington Station) | 69,337 | 99.9% | 7,142 Mbps | 5.1 | B+ | 82/100 |
| 11706 (Bay Shore) | 65,861 | 99.6% | 7,829 Mbps | 5.1 | B+ | 74/100 |
| 11717 (Brentwood) | 62,435 | 99.9% | 7,911 Mbps | 5.2 | B+ | 79/100 |
| 11757 (Lindenhurst) | 44,883 | 99.9% | 7,991 Mbps | 5.3 | B+ | 82/100 |
| 11772 (East Patchogue) | 44,717 | 94.3% | 7,557 Mbps | 5.3 | B+ | 72/100 |
| 11743 (Huntington) | 41,046 | 99.9% | 7,967 Mbps | 5 | B+ | 88/100 |
| 11704 (West Babylon) | 40,441 | 99.8% | 7,962 Mbps | 5.3 | B+ | 82/100 |
| 11779 (Ronkonkoma) | 37,938 | 99.9% | 7,940 Mbps | 5.2 | B+ | 79/100 |
| 11722 (Central Islip) | 37,305 | 97.3% | 7,614 Mbps | 5.2 | B+ | 72/100 |
| 11787 (Smithtown) | 35,432 | 99.1% | 7,705 Mbps | 5 | B+ | 87/100 |
| 11731 (East Northport) | 30,932 | 100.0% | 7,917 Mbps | 5 | B+ | 86/100 |
| 11901 (Riverhead) | 30,486 | 93.6% | 7,552 Mbps | 3.7 | B- | 56/100 |
| 11727 (Coram) | 30,441 | 73.4% | 6,115 Mbps | 3.7 | C+ | 66/100 |
| 11763 (Medford) | 29,277 | 85.9% | 6,720 Mbps | 4.6 | B- | 72/100 |
| 11725 (Commack) | 28,770 | 99.8% | 7,556 Mbps | 5 | B+ | 90/100 |
| 11720 (Centereach) | 28,576 | 95.6% | 7,693 Mbps | 5.3 | B+ | 87/100 |
| 11729 (Deer Park) | 28,469 | 100.0% | 7,943 Mbps | 5.2 | B+ | 75/100 |
| 11701 (North Amityville) | 27,524 | 100.0% | 7,879 Mbps | 5.5 | A- | 81/100 |
| 11741 (Holbrook) | 27,485 | 98.8% | 7,051 Mbps | 4.9 | B+ | 84/100 |
| 11967 (Shirley) | 26,384 | 99.2% | 7,957 Mbps | 3.5 | B | 73/100 |
| 11795 (West Islip) | 25,616 | 100.0% | 7,997 Mbps | 5.1 | B+ | 89/100 |
| 11784 (Selden) | 24,587 | 95.3% | 7,666 Mbps | 5.2 | B+ | 84/100 |
| 11776 (Port Jefferson Station) | 22,859 | 96.0% | 7,486 Mbps | 5 | B | 78/100 |
| 11790 (Stony Brook) | 22,221 | 69.1% | 6,695 Mbps | 4.6 | B- | 85/100 |
| 11768 (Northport) | 21,336 | 100.0% | 7,744 Mbps | 5.1 | B+ | 86/100 |
| 11726 (Copiague) | 21,002 | 99.9% | 7,893 Mbps | 5.3 | B+ | 78/100 |
| 11937 (Springs) | 19,873 | 95.8% | 7,704 Mbps | 3.5 | B- | 78/100 |
| 11747 (Melville) | 19,814 | 96.7% | 6,203 Mbps | 4.9 | B | 87/100 |
| 11754 (Kings Park) | 18,172 | 99.7% | 7,509 Mbps | 5 | B+ | 79/100 |
| 11733 (Setauket-East Setauket) | 17,548 | 96.0% | 7,479 Mbps | 5.2 | B+ | 91/100 |
| 11798 (Wyandanch) | 17,211 | 99.7% | 7,915 Mbps | 5.3 | B+ | 76/100 |
| 11738 (Farmingville) | 17,159 | 95.7% | 7,623 Mbps | 5.1 | B | 84/100 |
| 11703 (North Babylon) | 16,635 | 100.0% | 7,931 Mbps | 5.2 | B+ | 76/100 |
| 11950 (Mastic) | 16,333 | 99.1% | 7,937 Mbps | 4 | B | 82/100 |
| 11788 (Hauppauge) | 16,250 | 99.7% | 7,639 Mbps | 5 | B+ | 89/100 |
| 11782 (Sayville) | 15,613 | 99.3% | 7,849 Mbps | 5.3 | B+ | 77/100 |
| 11780 (St. James) | 15,500 | 99.9% | 7,529 Mbps | 5.2 | B+ | 85/100 |
| 11946 (Hampton Bays) | 15,277 | 98.9% | 7,964 Mbps | 3.8 | B | 68/100 |
| 11730 (East Islip) | 15,274 | 100.0% | 7,982 Mbps | 4.9 | B+ | 76/100 |
| 11751 (Islip) | 14,864 | 99.8% | 7,837 Mbps | 5.2 | B+ | 65/100 |
| 11968 (Southampton) | 14,702 | 95.5% | 7,761 Mbps | 3.4 | B- | 42/100 |
| 11949 (Manorville) | 14,573 | 81.3% | 6,683 Mbps | 3.7 | B- | 81/100 |
| 11702 (Babylon) | 14,524 | 99.7% | 7,817 Mbps | 5.6 | A- | 86/100 |
| 11767 (Nesconset) | 14,286 | 100.0% | 7,797 Mbps | 5.1 | B+ | 87/100 |
| 11951 (Mastic Beach) | 13,676 | 99.2% | 7,947 Mbps | 3.8 | B | 81/100 |
| 11961 (Ridge) | 13,207 | 87.5% | 7,078 Mbps | 4.5 | B- | 66/100 |
| 11778 (Rocky Point) | 12,801 | 94.5% | 7,511 Mbps | 4.4 | B | 81/100 |
| 11953 (Middle Island) | 12,566 | 77.4% | 6,279 Mbps | 4.3 | B- | 62/100 |
| 11742 (Holtsville) | 12,523 | 84.3% | 6,293 Mbps | 5 | B- | 85/100 |
| 11764 (Miller Place) | 12,212 | 89.5% | 7,260 Mbps | 4 | B- | 92/100 |
| 11755 (Lake Grove) | 12,174 | 97.8% | 7,563 Mbps | 4.9 | B+ | 88/100 |
| 11766 (Mount Sinai) | 12,050 | 73.8% | 5,926 Mbps | 4.4 | B- | 85/100 |
| 11713 (North Bellport) | 10,858 | 82.1% | 6,497 Mbps | 4.8 | B- | 72/100 |
| 11716 (Bohemia) | 10,315 | 100.0% | 7,841 Mbps | 5.1 | B+ | 75/100 |
| 11777 (Port Jefferson) | 10,144 | 96.7% | 7,739 Mbps | 5.6 | B+ | 80/100 |
| 11740 (Greenlawn) | 9,938 | 99.9% | 7,811 Mbps | 4.8 | B+ | 82/100 |
| 11752 (Islip Terrace) | 9,085 | 100.0% | 8,000 Mbps | 4.9 | B+ | 75/100 |
| 11769 (Oakdale) | 8,858 | 99.9% | 7,978 Mbps | 5.4 | A- | 73/100 |
| 11963 (Noyack) | 8,446 | 98.0% | 7,873 Mbps | 3.6 | B | 69/100 |
| 11792 (Wading River) | 8,326 | 85.6% | 6,755 Mbps | 4.6 | B- | 88/100 |
| 11934 (Center Moriches) | 8,247 | 96.3% | 7,748 Mbps | 3.7 | B | 86/100 |
| 11705 (Bayport) | 8,060 | 100.0% | 7,890 Mbps | 5.1 | B+ | 74/100 |
| 11789 (Sound Beach) | 7,647 | 100.0% | 7,996 Mbps | 4.4 | B+ | 76/100 |
| 11933 (Calverton) | 6,988 | 66.7% | 5,707 Mbps | 3.4 | C+ | 70/100 |
| 11786 (Shoreham) | 6,249 | 90.0% | 6,727 Mbps | 4.8 | B | 92/100 |
| 11721 (Centerport) | 6,235 | 100.0% | 7,890 Mbps | 5.1 | B+ | 91/100 |
| 11971 (Southold) | 6,156 | 96.8% | 7,821 Mbps | 3.1 | B- | 77/100 |
| 11942 (East Quogue) | 5,658 | 91.9% | 7,426 Mbps | 3.8 | B- | 63/100 |
| 11940 (East Moriches) | 5,513 | 95.3% | 7,666 Mbps | 3.8 | B | 80/100 |
| 11980 (Yaphank) | 5,191 | 68.8% | 5,807 Mbps | 4.2 | C+ | 63/100 |
| 11944 (Greenport) | 4,801 | 95.1% | 7,764 Mbps | 3.9 | B | 66/100 |
| 11952 (Mattituck) | 4,764 | 99.9% | 7,990 Mbps | 3.9 | B | 78/100 |
| 11715 (Blue Point) | 4,354 | 99.1% | 7,937 Mbps | 5.5 | B+ | 83/100 |
| 11954 (Montauk) | 4,346 | 95.8% | 7,705 Mbps | 3.7 | B- | 77/100 |
| 11978 (Westhampton Beach) | 4,171 | 97.8% | 7,855 Mbps | 3.9 | B | 82/100 |
| 11796 (West Sayville) | 4,068 | 99.7% | 7,546 Mbps | 5 | B+ | 86/100 |
| 11749 (Islandia) | 3,738 | 93.2% | 7,665 Mbps | 5.4 | B | 71/100 |
| 11935 (Cutchogue) | 3,493 | 98.5% | 7,907 Mbps | 3.2 | B | 63/100 |
| 11719 (Brookhaven) | 3,458 | 100.0% | 7,637 Mbps | 5.6 | A- | 85/100 |
| 11955 (Moriches) | 3,258 | 100.0% | 8,000 Mbps | 3.9 | B+ | 36/100 |
| 11718 (Brightwaters) | 3,163 | 99.8% | 7,996 Mbps | 5.1 | B+ | 94/100 |
| 11724 (Cold Spring Harbor) | 3,138 | 99.2% | 8,000 Mbps | 4.7 | B+ | 90/100 |
| 11977 (Westhampton) | 2,798 | 91.9% | 7,427 Mbps | 3.9 | B- | 86/100 |
| 11976 (Watermill) | 2,758 | 97.1% | 7,828 Mbps | 3.8 | B | 81/100 |
| 11941 (Eastport) | 2,547 | 80.2% | 6,583 Mbps | 3.7 | C+ | 77/100 |
| 11964 (Shelter Island) | 2,159 | 95.7% | 7,721 Mbps | 3.7 | B | 45/100 |
| 11932 (Bridgehampton) | 2,139 | 100.0% | 8,000 Mbps | 3.7 | B | 63/100 |
| 11930 (Amagansett) | 2,075 | 99.8% | 8,000 Mbps | 3.8 | B | 36/100 |
| 11959 (Quogue) | 1,574 | 88.3% | 7,175 Mbps | 3.8 | B- | 61/100 |
| 11960 (Remsenburg) | 1,412 | 100.0% | 8,000 Mbps | 3.6 | B | 61/100 |
| 11972 (Speonk) | 1,370 | 100.0% | 8,000 Mbps | 4 | B+ | 77/100 |
| 11739 (Great River) | 1,256 | 100.0% | 8,000 Mbps | 4.6 | B+ | 58/100 |
| 11948 (Laurel) | 1,149 | 100.0% | 8,000 Mbps | 3.6 | B | 66/100 |
| 11965 (Shelter Island Heights) | 1,094 | 91.8% | 7,473 Mbps | 4 | B- | 39/100 |
| 11962 (Sagaponack) | 1,081 | 94.5% | 7,615 Mbps | 3.1 | B- | 57/100 |
| 11939 (East Marion) | 1,048 | 87.1% | 7,091 Mbps | 3.4 | B- | 48/100 |
| 11957 (Orient) | 1,004 | 97.0% | 7,823 Mbps | 3.7 | B | 57/100 |
| 11975 (Wainscott) | 656 | 86.9% | 7,074 Mbps | 3.5 | B- | 35/100 |
| 11958 (Peconic) | 654 | 100.0% | 8,000 Mbps | 3.8 | B+ | 74/100 |
| 11970 (Riverhead) | 496 | 100.0% | 8,000 Mbps | 3.4 | B | 80/100 |
| 06390 (Fishers Island) | 424 | 88.7% | 446 Mbps | 2.2 | D+ | 51/100 |
| 11956 (Cutchogue) | 330 | 99.4% | 8,000 Mbps | 2.6 | B | 77/100 |
| 11770 (Ocean Beach) | 272 | 98.5% | 2,295 Mbps | 3.3 | B- | 63/100 |
| 11947 (Jamesport) | 269 | 100.0% | 8,000 Mbps | 3.7 | B | 54/100 |
| 11931 (Riverhead) | 113 | 100.0% | 8,000 Mbps | 4 | B+ | 34/100 |
| 11973 (Ridge) | 33 | 0.0% | 25 Mbps | 0 | F | 61/100 |
Who is the Fastest Internet Provider in Suffolk County?
According to unbiased feedback from real internet customers, they reported being happiest with speeds provided by EarthLink. On the other hand, based on data provided by the internet providers to the FCC, Optimum should have faster speeds at a local level. While we typically put more weight on real-world customer ratings, we display both satisfaction and technical maximum information for customers to decide for themselves.
Data Reported to FCC by ISPs: Average Maximum Available in Suffolk County
| Optimum | 8,000 |
|---|---|
| Verizon | 2,300 |
| EarthLink | 2,300 |
| Viasat | 100 |
| T-Mobile Home Internet | 100 |
| HughesNet | 25 |
How fast is your internet?
Test your connection here and see it next to the speeds providers advertise in Suffolk County. It takes about 20 seconds and, on a fast line, can move a few hundred MB of data.
Customer Ratings for Suffolk County Internet Providers
Based on 254 reviews from New York internet customers, EarthLink is the best internet service provider for Suffolk County residents. EarthLink was rated at an average of 3.00 out of 5 in our report for overall customer satisfaction. T-Mobile Home Internet wins for second-place in New York, with 4.22 out of 5 stars and 91.1% coverage in Suffolk County.
At a national level, based on 1455 national reviews for any of the providers listed above, T-Mobile Home Internet is rated higher than any other provider, with a rating of 4.01 out of 5.
Local, State, and National Ratings for all Suffolk County Internet Providers
The table below shows average customer ratings from customers in Suffolk County, New York, and customers throughout the country.
| ISP / Tech Type | Suffolk County Overall | New York Overall | National Overall | For Service | ||
|---|---|---|---|---|---|---|
| Verizon | (7) | (140) | (818) | View Plans | ||
| EarthLink |  (0) | (1) | (15) | View Plans | ||
| T-Mobile Home Internet | (0) | (18) | (343) | View Plans | ||
| Optimum | (23) | (95) | (279) | View Plans | ||
| HughesNet | (0) | (0) |  (25) | View Plans | ||
| Viasat | (0) | (0) |  (12) | View Plans |
Customer Ratings for Internet Provider Speeds in Suffolk County
Based on data reported by Suffolk County ISPs to the FCC, the fastest speeds in the county are available through Optimum. The company offers speeds up to 8,000 Mbps in Suffolk County. Therefore, the average customer can get up to 7,566 Mbps if they’re willing to purchase the fastest subscription tier available at their homes.
However, actual customers rated their satisfaction with internet speed highest with EarthLink. This indicates EarthLink reliably delivers speeds expected by the customer based on the plan they are paying for.
| ISP / Tech Type | Suffolk County Speed | New York Speed | National Speed | For Service | ||
|---|---|---|---|---|---|---|
| Verizon | (7) | (140) | (818) | View Plans | ||
| EarthLink | (0) | (1) | (15) | View Plans | ||
| T-Mobile Home Internet | (0) | (18) | (343) | View Plans | ||
| Optimum | (23) | (95) | (279) | View Plans | ||
| HughesNet | (0) | (0) | (25) | View Plans | ||
| Viasat | (0) | (0) | (12) | View Plans |
Who is the Cheapest Internet Provider in Suffolk County?
Of the providers in Suffolk County, customers rate EarthLink the best for price. Data comes from customers rating their satisfaction with pricing: in Suffolk County where enough of them have reviewed a provider, otherwise across New York or the country. This feedback is valuable because it considers price changes and whether the speeds paid for are worth it.
EarthLink is rated 2.00 out of 5 for price, which is much lower than the average across all internet providers in the country. T-Mobile Home Internet is rated second for affordability, with an average price rating of 4.11 out of 5.
The table below shows how customers in Suffolk County, New York, and the United States rated the affordability of their internet service.
Rated Affordability in Suffolk County
| ISP / Tech Type | Suffolk County Affordability | New York Affordability | National Affordability | For Service | ||
|---|---|---|---|---|---|---|
| EarthLink | (0) |  (1) | (15) | View Plans | ||
| T-Mobile Home Internet | (0) | (18) | (343) | View Plans | ||
| Verizon | (7) | (140) | (818) | View Plans | ||
| Optimum | (23) | (95) | (279) | View Plans | ||
| HughesNet | (0) | (0) | (25) | View Plans | ||
| Viasat | (0) | (0) | (12) | View Plans |
Fiber, 5G, Cable and DSL Internet in Suffolk County
Which Fiber Internet Providers are Available in Suffolk County?
Optimum Fiber in Suffolk County, NY

Availability:
92.8%
Customer Rating:
(55)
Avg. Download Speed
7,997 Mbps
Optimum offers Fiber service to 92.8% of Suffolk County homes. Across the county, Optimum Fiber has speeds up to 7,997 Mbps, with speeds from 100 Mpbs up to 8,000 Mbps depending on the address. Upload speeds are symmetrical, meaning they are exactly the same as download speeds for Optimum Fiber. Optimum Fiber is rated lower than other types of internet service available in Suffolk County from Optimum in terms of customer satisfaction.
EarthLink Fiber in Suffolk County, NY
Availability:
74.7%
Customer Rating:
(6)
Avg. Download Speed
1,968 Mbps
EarthLink offers Fiber service to 74.7% of Suffolk County homes. Across the county, EarthLink Fiber is the only type of service available from the company, with speeds up to 1,968 Mbps, with speeds from 980 Mpbs up to 2,300 Mbps depending on the address. Upload speeds differ from download speeds, and are as low 880 and as high as 2,300, with an average of 1,943 Mbps throughout the county.
Verizon Fiber in Suffolk County, NY

Availability:
74.7%
Customer Rating:
(453)
Avg. Download Speed
1,968 Mbps
Verizon offers Fiber service to 74.7% of Suffolk County homes. Across the county, Verizon Fiber has speeds up to 1,968 Mbps, with speeds from 980 Mpbs up to 2,300 Mbps depending on the address. Upload speeds differ from download speeds, and are as low 880 and as high as 2,300, with an average of 1,943 Mbps throughout the county. Verizon Fiber is rated about the same as other types of internet service available in Suffolk County from Verizon in terms of customer satisfaction.
Which Fixed Wireless and LTE Internet Providers are Available in Suffolk County?
T-Mobile Home Internet Fixed Wireless in Suffolk County, NY

Availability:
91.1%
Customer Rating:
(343)
Avg. Download Speed
65 Mbps
T-Mobile Home Internet offers Fixed Wireless service to 91.1% of Suffolk County homes. Across the county, T-Mobile Home Internet Fixed Wireless is the only type of service available from the company, with speeds up to 65 Mbps, with speeds from 25 Mpbs up to 100 Mbps depending on the address. Upload speeds differ from download speeds, and are as low 3.0 and as high as 20, with an average of 12 Mbps throughout the county.
Verizon Fixed Wireless in Suffolk County, NY
Availability:
45.6%
Customer Rating:
(364)
Avg. Download Speed
174 Mbps
Verizon offers Fixed Wireless service to 45.6% of Suffolk County homes. Across the county, Verizon Fixed Wireless has speeds up to 174 Mbps, with speeds from 25 Mpbs up to 300 Mbps depending on the address. Upload speeds differ from download speeds, and are as low 6.0 and as high as 20, with an average of 14 Mbps throughout the county.
Which Cable Internet Providers are Available in Suffolk County?
Optimum Cable in Suffolk County, NY
Availability:
98.8%
Customer Rating:
(223)
Avg. Download Speed
940 Mbps
Optimum offers Cable service to 98.8% of Suffolk County homes. Across the county, Optimum Cable has speeds up to 940 Mbps
Which DSL Internet Providers are Available in Suffolk County?
According to the most recently submitted data by internet service providers to the FCC, there are currently no DSL providers available in Suffolk County, NY.
Customer Reviews for Internet Service Providers in New York
Customer Reviews
A Rocky Point, NY Customer
Optimum Fiber
June 05, 2026 I live in an area where there is really only one internet provider- optimum. This has allowed them to keep prices high, as they know we don’t have another option. The internet is very slow, where my computer has difficulty running a zoom meeting with an internet browser window open. This is very problematic given I work at home sometimes. I don’t even live in a remote area (downstate NY) so the poor service doesn’t make sense. When I call for customer service, they just keep trying to get us to upgrade our internet. I have one of the medium level plans, which should be plenty (I don’t run high speed games or complex programming).
Jen C
Verizon Fiber
April 02, 2026 I pay $65 a month on autopay for internet alone. I am happy with the price, It's easy to keep up with. Unfortunately, I rate the service itself about 3 out of 5 stars. I have so many issues with our streaming services freezing CONSTANTLY- to the point where watching TV isn't even enjoyable. Our wi-fi is also difficult to deal with- if I go in my backyard I lose service on my phone.
A Mount Sinai, NY Customer
Optimum Cable
 January 16, 2026
A West Islip, NY Customer
Optimum Cable
November 01, 2025 Nancy I
Optimum Cable
September 14, 2025 For a long time, Optimum was the only option we had for internet, phone, and/or cable service. (It was called Cablevision at that time) I admit that when I moved into my own apartment and needed to get a WIFI service, I signed up with Optimum out of convenience and familiarity. I knew that I wasn't going to bother with a land line and I subscribe to enough streaming services that cable wouldn't be necessary, so I signed with Optimum for internet service ONLY. My mother, who lives less than 10 miles away, uses Optimum for all three services, and she pays $70/month. As I said, I ONLY have internet service, and I pay $80! When I called them to ask why and to question as to whether they could offer me any kind of deal, they said I had the cheapest plan, and since I am an existing customer, I was not eligible for the "new customer" deal they were running. It makes me angry that only new customers get better pricing and there is no reward or incentive for loyalty. And it's because of that, that I have been "shopping around" for a new internet service provider. I know that losing my business doesn't make a difference to them, but for me, it's the principal.
Rate your provider
Share your experience to help others in your area choose.
Verified customer: we detected your connection is on this provider.
Reviews are independent and unedited. Published after a quick spam check.
Which ISP Should You Choose in Suffolk County?
The right ISP for you depends upon your needs, but in general we can make the following suggestions:
- The best all-around internet service provider in Suffolk County is EarthLink.
- The fastest internet provider should be Optimum. Considering speed for the money and reliability in speeds, EarthLink may be a better choice based on real-world local customer feedback.
- The most affordable internet provider in Suffolk County is EarthLink.
- Viasat, Optimum, and HughesNet has the broadest coverage in Suffolk County, available to 98.8% of homes, and is most likely to cover your home. To find out exactly what’s available at your home, please use our address search tool.