
Best Internet Providers in Cook County, IL
All 9 providers, ranked by coverage, speed and customer ratings
Find internet availability by address in Cook County, IL
Cook County has 9 internet service providers, they are sorted by coverage, available speed, and customer rating from our unbiased internet provider report. Fiber, Cable, DSL, and Fixed Wireless internet are available in the county. Reviews are grouped by provider and the type of service they offer, covering all 4 available internet technologies in Cook County.
Ranks compare Cook County with the 102 Illinois counties.
The Best Internet in Cook County, IL at a Glance
Cook County Internet Providers, Ranked by Coverage, Speed and Customer Ratings
XFINITY
Connection

Customer Rating
Cable

EarthLink
Connection
Customer Rating
Fiber
DSL

Fixed Wireless
AT&T
Connection
Customer Rating
Fiber

DSL
Fixed Wireless
Astound Broadband
Connection
Customer Rating
Fiber
Cable


Providers with less than 1% coverage in this county are excluded from the list. To see if one of these providers is available at your home, please use the address search above.
Speed and technology may vary by address for all providers. Please note we may have a financial relationship with some of the providers above, which does not impact the customer ratings displayed. Customer ratings listed above are national ratings, local Cook County ratings may vary and are shown below.
Who is the Best Internet Provider in Cook County, IL?
Verizon is the highest-rated internet provider in Cook County based on 316 Illinois customer reviews, and T-Mobile Home Internet has the highest rating nationwide. The provider information above and the information immediately below can help you decide. Compare provider ratings and review counts above.

or call 1-833-213-7018
Which Providers are Available at my Home in Cook County?
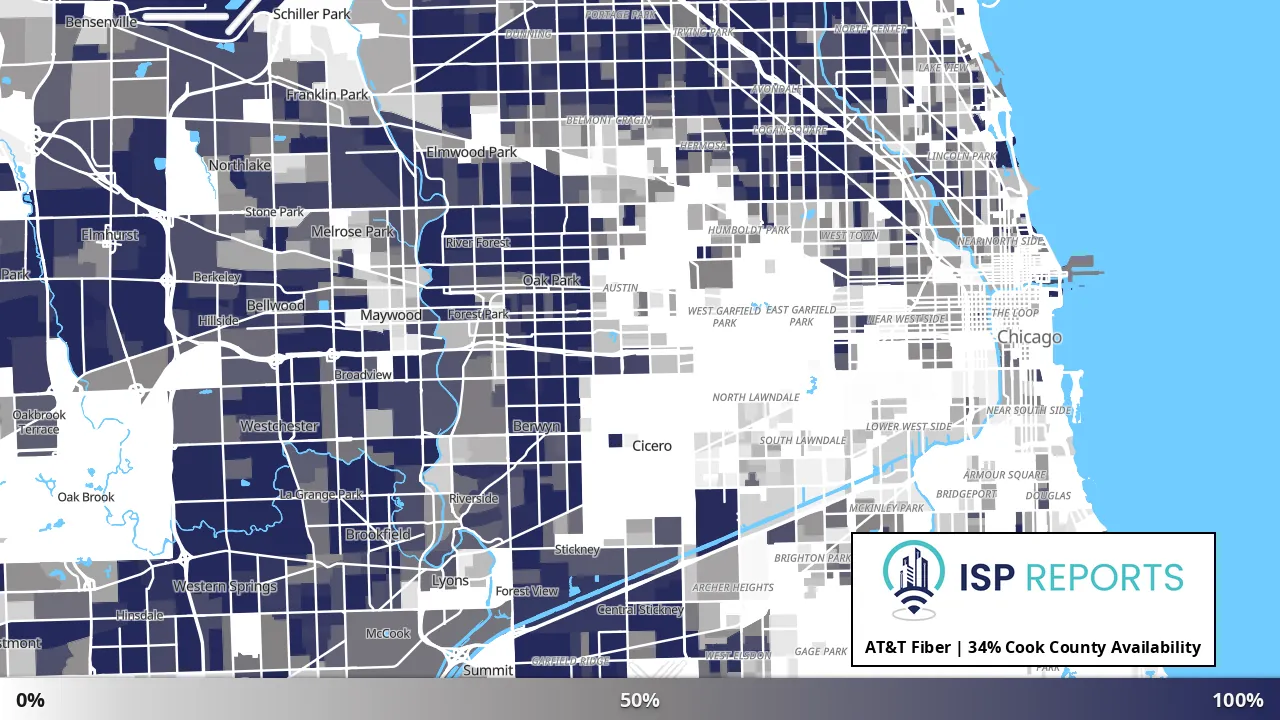
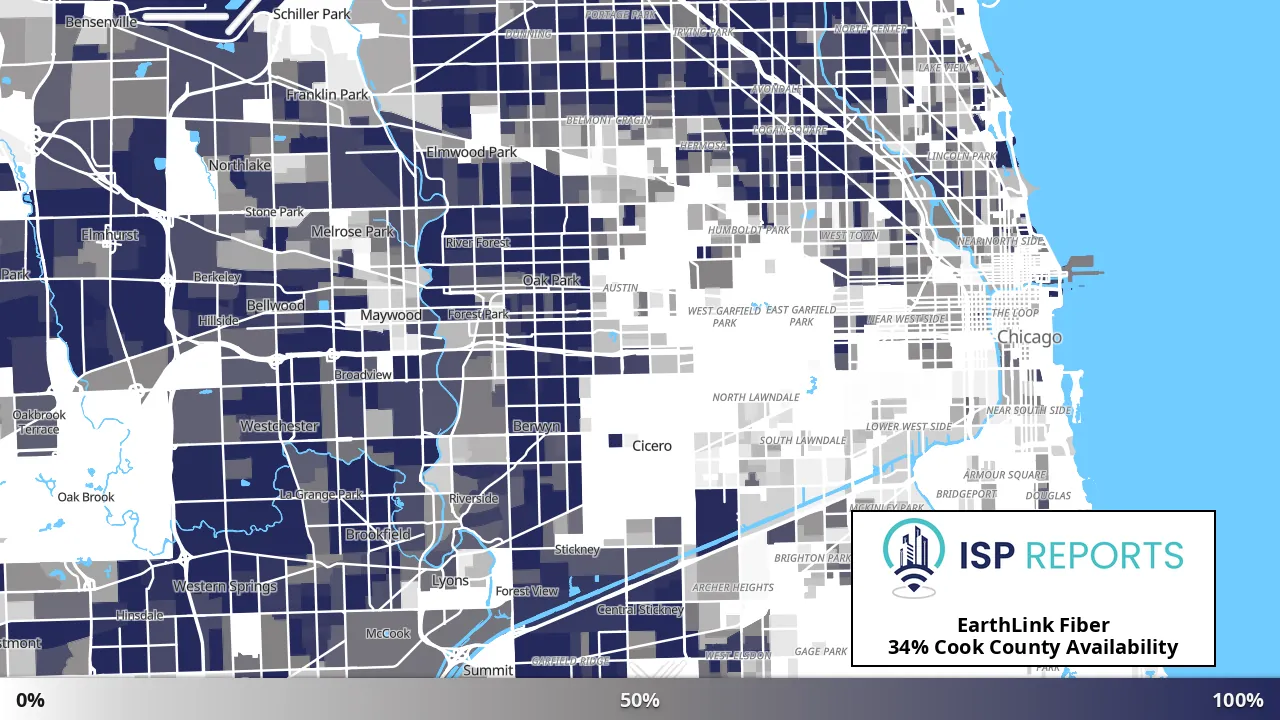
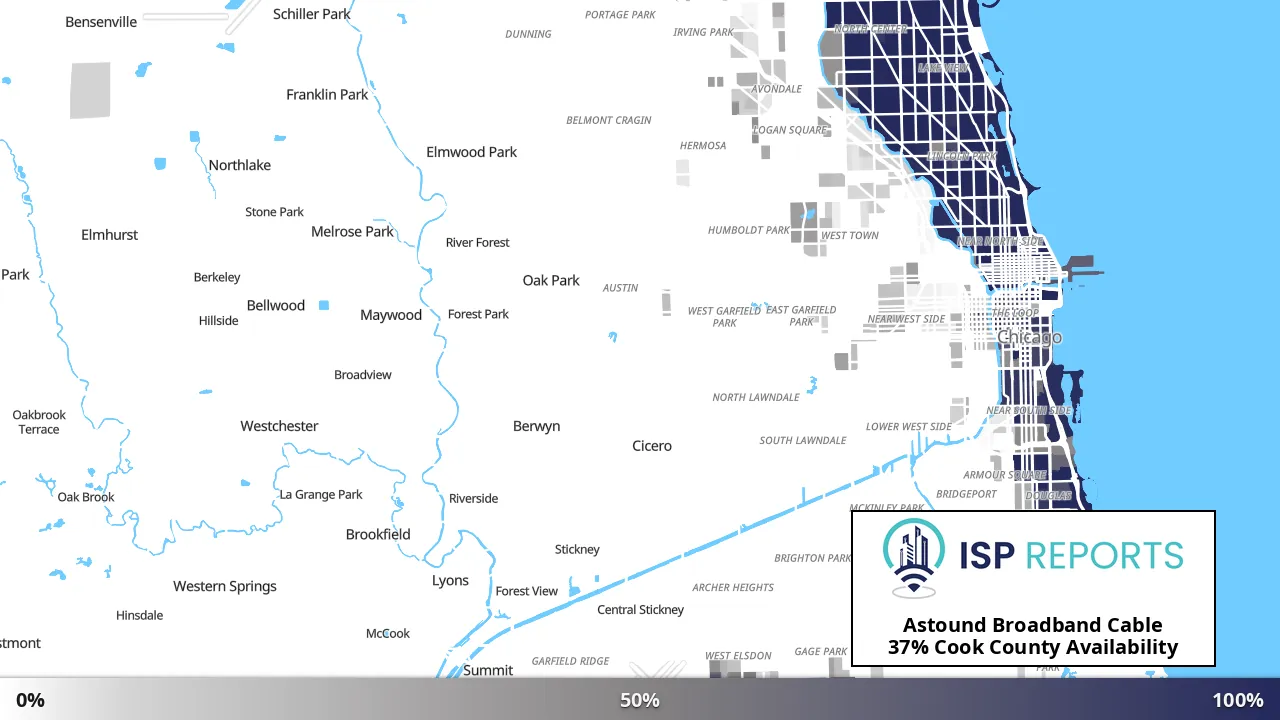
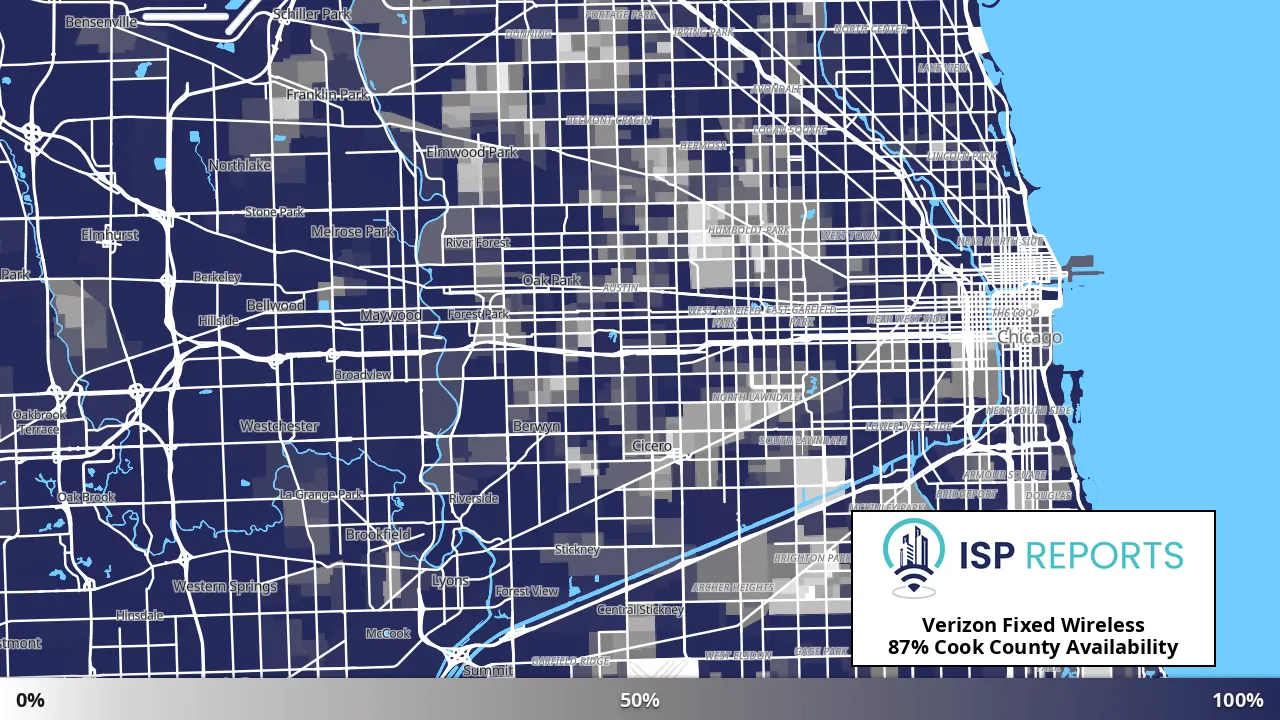
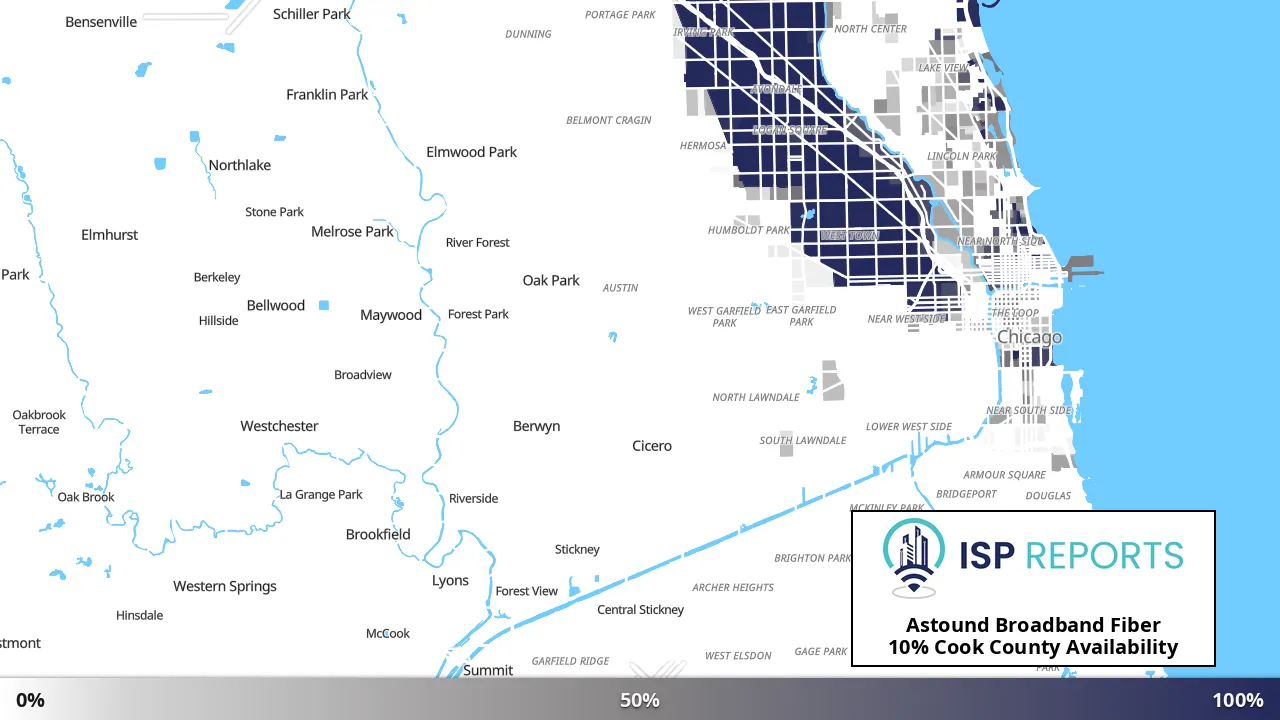
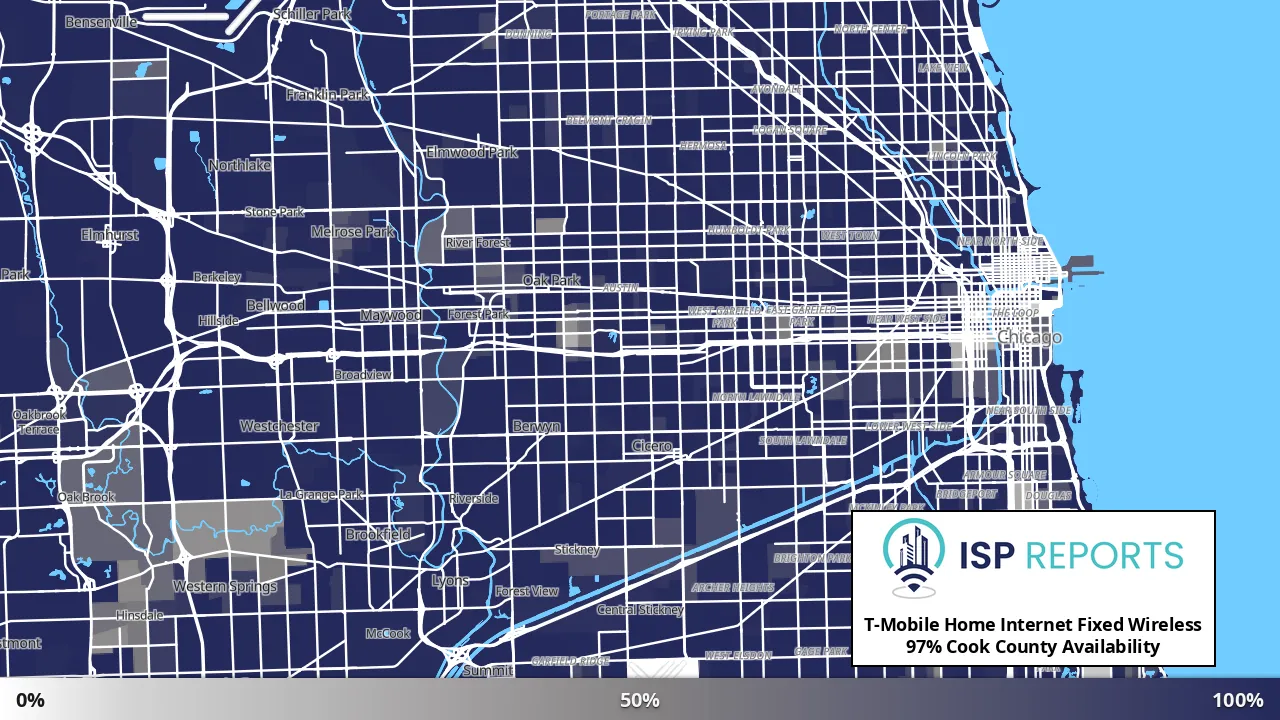
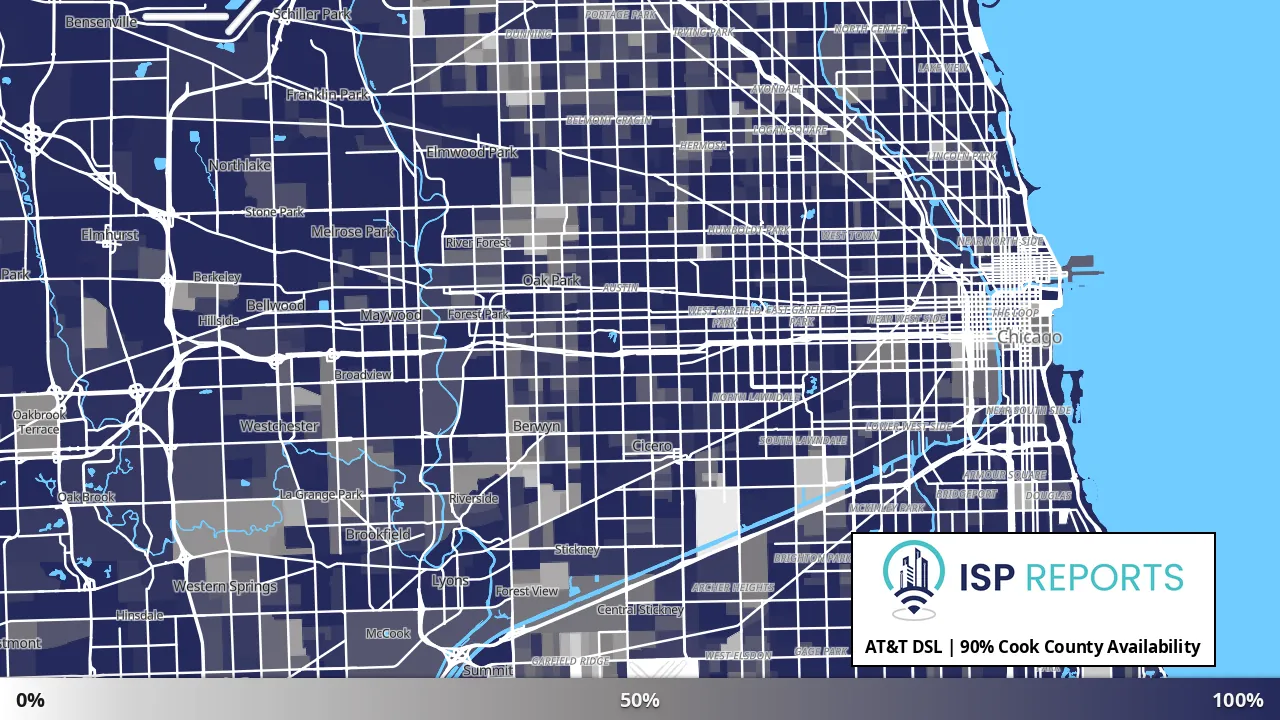
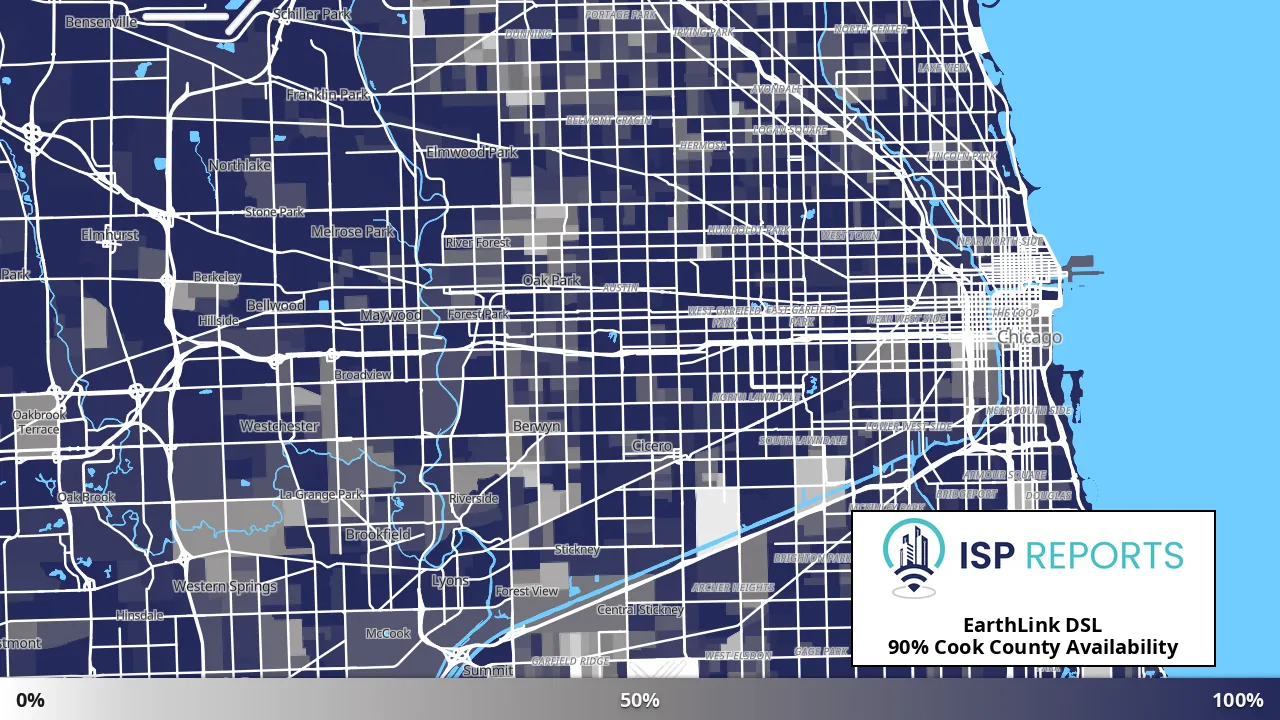
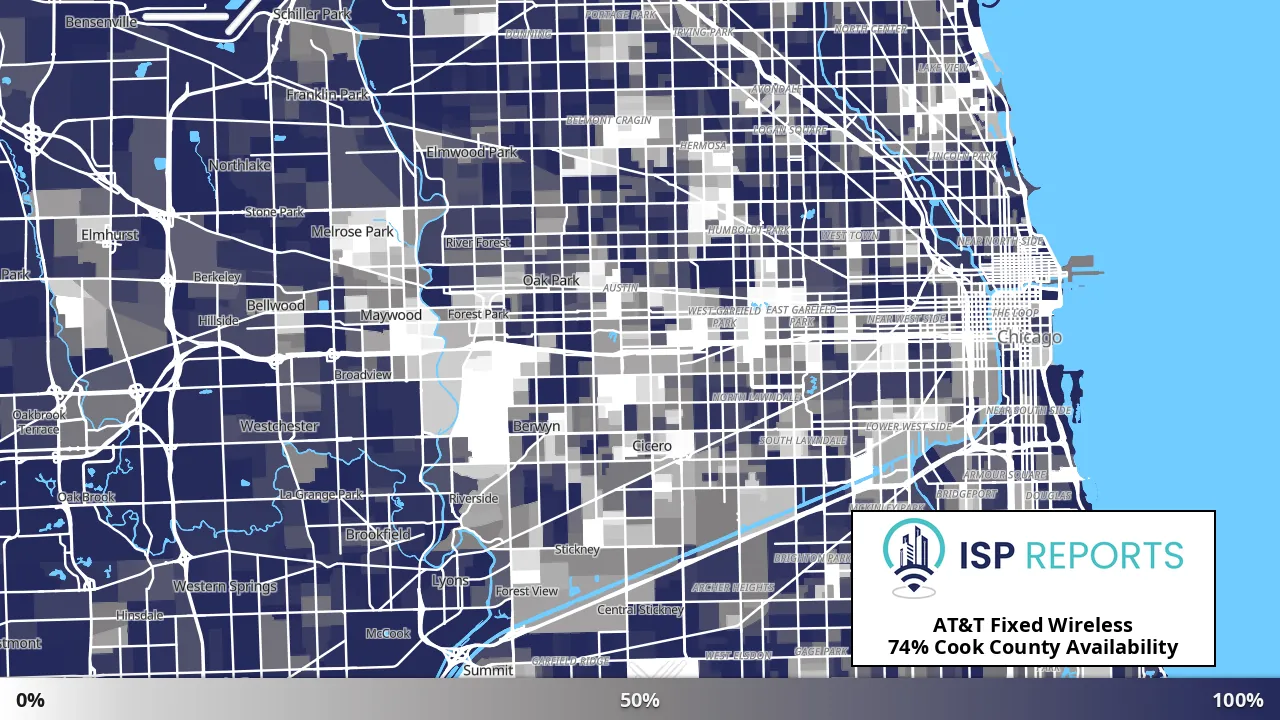
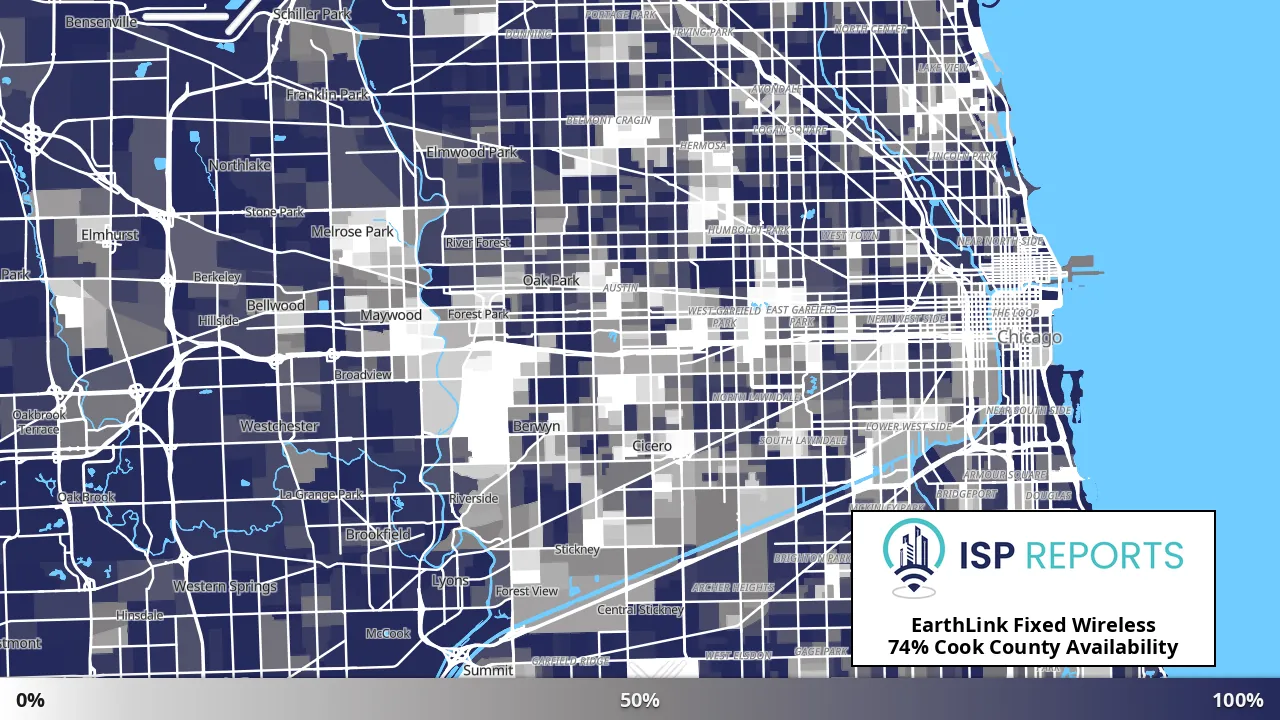
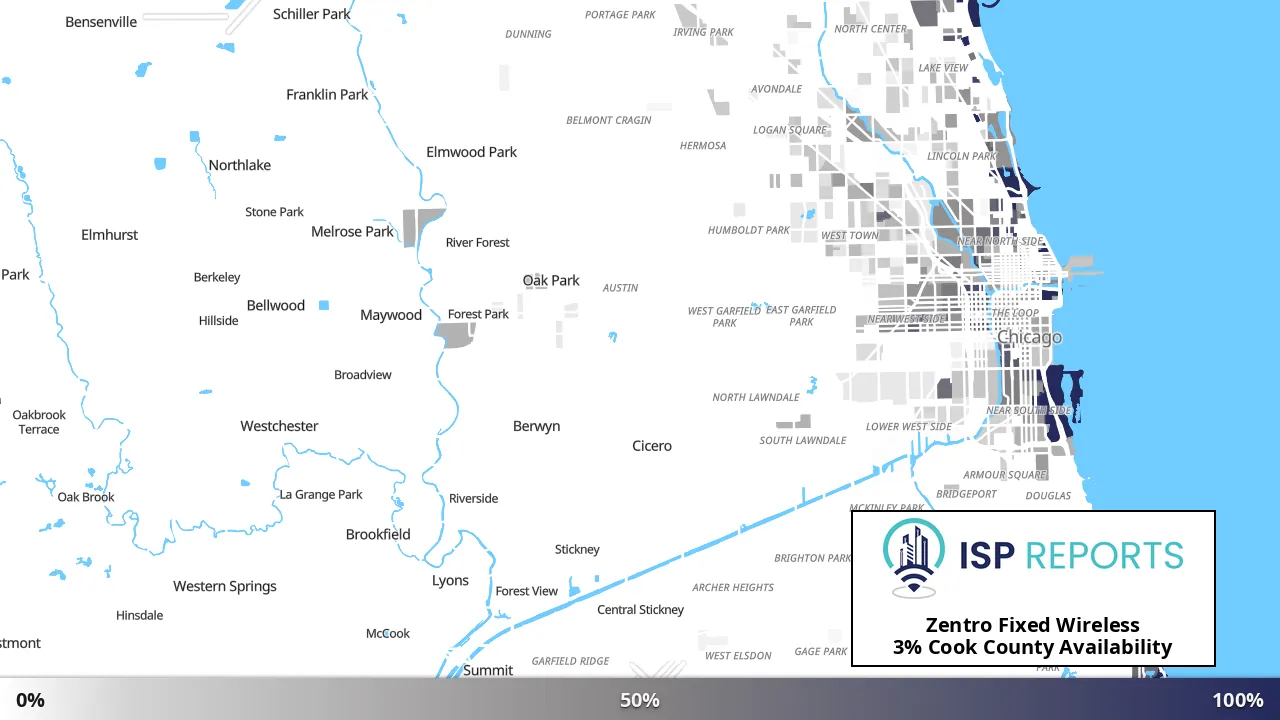
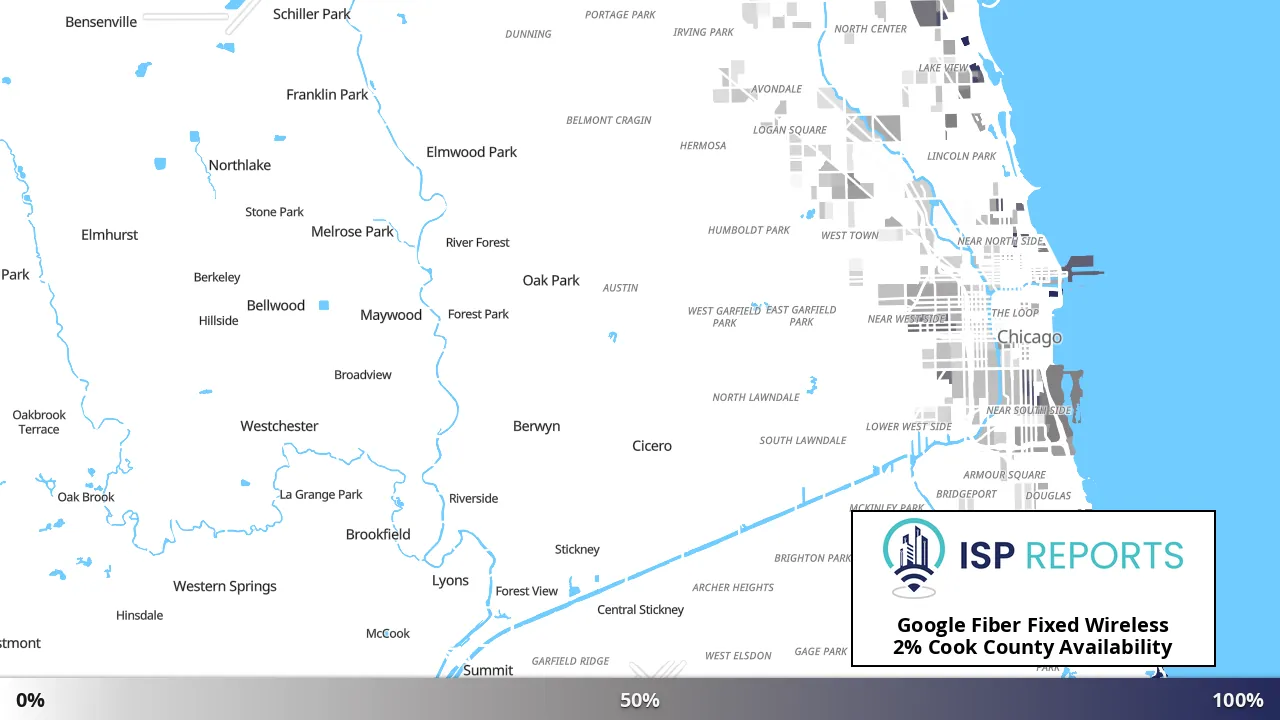
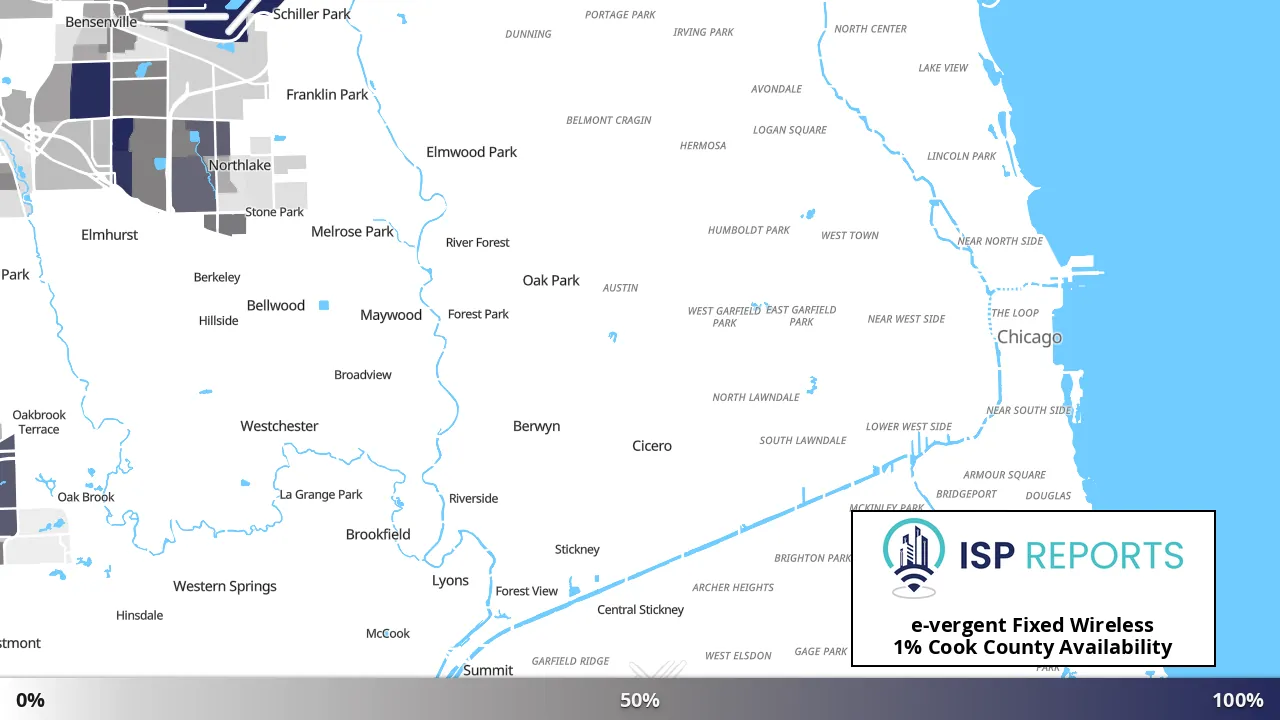
Coverage changes block by block. Pick a provider and a technology to see where its service reaches: the darker the area, the larger the share of homes it covers. For your exact address, use the address search above.
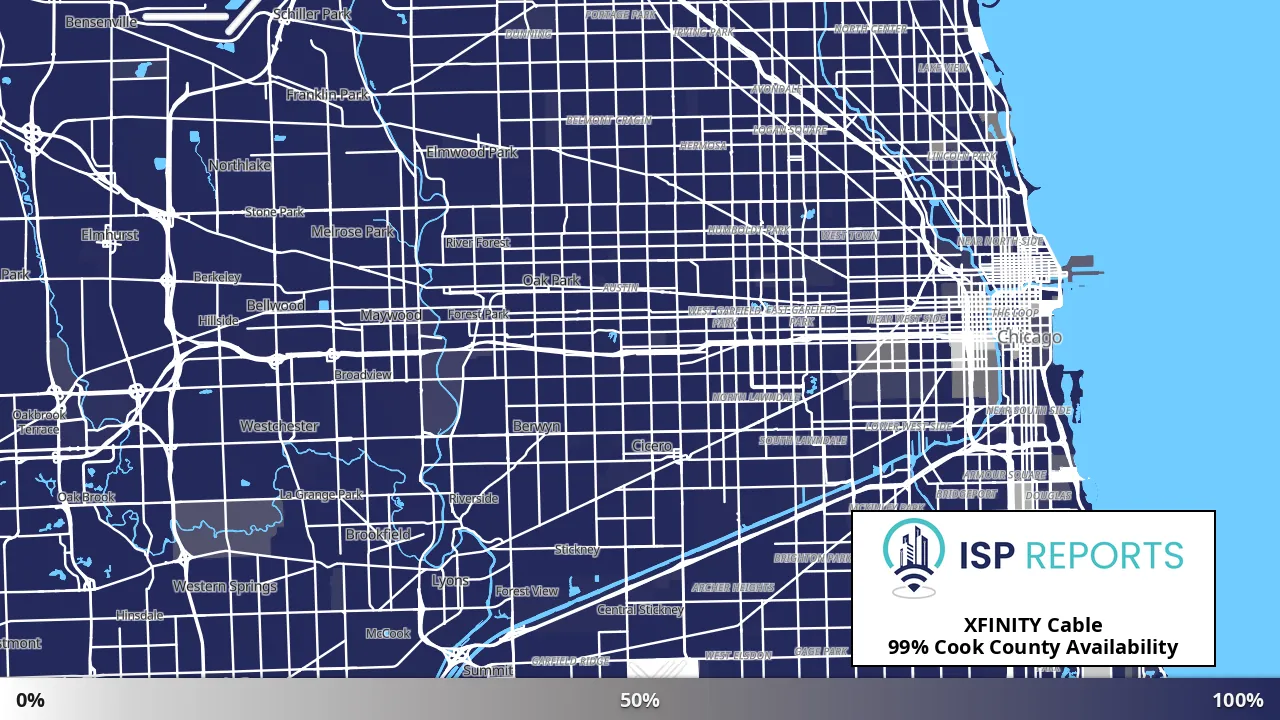
Coverage map for each provider in Cook County
- XFINITY - cable coverage map
- AT&T - fiber coverage map
- EarthLink - fiber coverage map
- Astound Broadband - cable coverage map
- Verizon - fixed wireless coverage map
- Astound Broadband - fiber coverage map
- T-Mobile Home Internet - fixed wireless coverage map
- AT&T - dsl coverage map
- EarthLink - dsl coverage map
- AT&T - fixed wireless coverage map
- EarthLink - fixed wireless coverage map
- Zentro - fixed wireless coverage map
- Google Fiber - fixed wireless coverage map
- e-vergent - fixed wireless coverage map
How Cook County Compares to the Rest of Illinois
Cook County's report card score is tied 51st of 102 and its connectivity index is 8th of 102.
| Measure | Cook County | Rank among Illinois counties | Illinois | US | Leader |
|---|---|---|---|---|---|
| ISP Report Card inputs: what providers offer here | |||||
| Fiber availability | 39.1% | 94th of 102 | 47.6% | 71.5% | Hardin County (99.4%) |
| Average top speed | 2,635 Mbps | 68th of 102 | 3,187 Mbps | 3,486 Mbps | Champaign County (6,608 Mbps) |
| Providers at a typical address | 7.4 | Tied 17th of 102 | 7.3 | 7.1 | Champaign County (9.4) |
| Connectivity index inputs: how much households need and use the internet | |||||
| People per household | 2.6 | Tied 11th of 102 | 2.6 | 2.7 | Calhoun County (3.6) |
| Workers who work from home | 18% | Tied 4th of 102 | 16% | 15% | DuPage County (22%) |
| Homes with a computer, tablet or phone | 95% | Tied 16th of 102 | 95% | 96% | DuPage County and Kendall County and 1 more (98%) |
| Homes with internet | 91% | Tied 14th of 102 | 91% | 91% | Kendall County and McHenry County (96%) |
| Homes on fiber, cable or DSL | 76% | Tied 10th of 102 | 75% | 76% | Kendall County (86%) |
| More about the households here | |||||
| Homes with a desktop or laptop | 80% | Tied 13th of 102 | 81% | 81% | Kendall County (90%) |
| Median household income | $94,315 | 12th of 102 | $95,616 | $93,246 | Lake County ($124,748) |
| Residents in school (6th grade to college) | 16% | Tied 14th of 102 | 16% | 16% | Champaign County (31%) |
Fiber reaches 39.1% of homes in Cook County, against 47.6% across Illinois. Households in Cook County are smaller than the US average (2.6 people against 2.7); 18% of workers work from home (US 15%); and the median household income is $94,315 (US $93,246).
Our demographic data is sourced from the latest 5-year release of the American Community Survey by the US Census Bureau.
How Cook County Compares to Its Neighbors
Cook County has 8 neighbors, 3 of them in Indiana and Michigan. Among them, Porter County, IN has the most homes with fiber (78.6%) and Lake County the fewest (24.0%); Cook County has 39.1%.
Map of Cook County and its neighbors by ISP Report Card grade
Hover over or tap a county for its numbers, and click through to its page.
Cook County and its neighbors
| County | People | Homes with fiber | Average top speed | Providers at a typical address | Report card | Connectivity |
|---|---|---|---|---|---|---|
| Cook County (this page) | 5,275,541 | 39.1% | 2,635 Mbps | 7.4 | B- | 68/100 |
| DuPage County | 932,877 | 32.5% | 2,878 Mbps | 7.5 | B- | 84/100 |
| Lake County | 714,342 | 24.0% | 2,655 Mbps | 7.2 | B- | 84/100 |
| Will County | 696,355 | 30.8% | 2,788 Mbps | 7.6 | B- | 82/100 |
| Kane County | 516,522 | 58.2% | 3,591 Mbps | 8.2 | B | 81/100 |
| Lake County, IN | 498,700 | 46.9% | 3,364 Mbps | 7.3 | B- | 62/100 |
| McHenry County | 310,229 | 44.7% | 4,192 Mbps | 7.7 | B | 81/100 |
| Porter County, IN | 173,215 | 78.6% | 5,734 Mbps | 6.6 | B | 67/100 |
| Berrien County, MI | 154,316 | 53.5% | 2,887 Mbps | 6.9 | B- | 51/100 |
Internet in Cook County by City and ZIP Code
Fiber reaches from 0.0% of homes in Dolton to 100.0% in Hometown; by ZIP code, from 0.0% in 60419 (Dolton) to 100.0% in 60456 (Hometown). Each row links to that place’s page.
Cities and towns in Cook County
| City or town | People | Homes with fiber | Average top speed | Providers at a typical address | Report card | Connectivity |
|---|---|---|---|---|---|---|
| Chicago metro area | 9,449,351 | 40.1% | 2,907 Mbps | 7.5 | B- | 74/100 |
| Des Plaines | 86,526 | 52.1% | 3,130 Mbps | 8.2 | B | 73/100 |
| Cicero | 85,268 | 3.6% | 2,102 Mbps | 5.5 | C | 55/100 |
| Evanston | 82,744 | 13.4% | 2,223 Mbps | 7.8 | B- | 74/100 |
| Arlington Heights | 81,430 | 24.7% | 2,542 Mbps | 8 | B- | 79/100 |
| Schaumburg | 78,284 | 21.9% | 2,482 Mbps | 7.8 | B- | 82/100 |
| Palatine | 70,571 | 13.2% | 2,071 Mbps | 6.9 | C+ | 83/100 |
| Skokie | 63,190 | 71.4% | 3,594 Mbps | 8.1 | B+ | 81/100 |
| Orland Park | 63,084 | 36.9% | 2,189 Mbps | 7 | B- | 78/100 |
| Oak Lawn | 58,173 | 77.6% | 4,261 Mbps | 8 | B+ | 68/100 |
| Berwyn | 57,128 | 88.8% | 4,485 Mbps | 7.3 | B+ | 69/100 |
| Mount Prospect | 56,252 | 17.9% | 2,529 Mbps | 7.9 | B- | 80/100 |
| Tinley Park | 54,609 | 21.8% | 2,642 Mbps | 6.7 | C+ | 72/100 |
| Oak Park | 54,583 | 92.2% | 4,086 Mbps | 7.7 | B+ | 77/100 |
| Hoffman Estates | 53,638 | 31.1% | 2,717 Mbps | 7.3 | B- | 85/100 |
| Glenview | 44,296 | 3.2% | 1,984 Mbps | 7.4 | C+ | 80/100 |
| Elmwood Park | 43,396 | 56.6% | 3,033 Mbps | 7.3 | B | 64/100 |
| Northbrook | 40,569 | 74.3% | 3,733 Mbps | 8.1 | B+ | 77/100 |
| Streamwood | 40,435 | 6.5% | 2,205 Mbps | 7.7 | B- | 79/100 |
| Park Ridge | 39,656 | 81.8% | 4,056 Mbps | 8.3 | B+ | 84/100 |
| Wheeling | 38,603 | 26.7% | 2,732 Mbps | 7.4 | B- | 75/100 |
| Elk Grove Village | 36,620 | 25.4% | 2,063 Mbps | 7.8 | B- | 74/100 |
| Calumet City | 36,033 | 41.9% | 3,209 Mbps | 7.2 | B- | 65/100 |
| Melrose Park | 33,989 | 43.2% | 3,122 Mbps | 6.8 | B- | 63/100 |
| Niles | 32,047 | 26.5% | 2,692 Mbps | 6.3 | C+ | 60/100 |
| Lansing | 29,731 | 10.2% | 2,164 Mbps | 6.7 | C+ | 69/100 |
| Burbank | 29,439 | 52.2% | 3,559 Mbps | 7.7 | B | 64/100 |
| Chicago Heights | 28,352 | 1.5% | 1,910 Mbps | 6.8 | C+ | 56/100 |
| Wilmette | 28,170 | 71.9% | 3,813 Mbps | 8 | B+ | 87/100 |
| Oak Forest | 27,705 | 10.5% | 2,203 Mbps | 7.8 | B- | 71/100 |
| Morton Grove | 25,297 | 44.0% | 3,292 Mbps | 7.6 | B | 72/100 |
| Rolling Meadows | 24,251 | 22.5% | 2,669 Mbps | 8.1 | B- | 75/100 |
| Maywood | 23,518 | 46.9% | 3,150 Mbps | 6.7 | B- | 55/100 |
| Lemont | 23,108 | 10.4% | 2,054 Mbps | 6.7 | C+ | 79/100 |
| Blue Island | 22,653 | 96.7% | 2,818 Mbps | 8.2 | A- | 54/100 |
| Matteson | 22,461 | 14.3% | 2,174 Mbps | 6.8 | C+ | 82/100 |
| South Holland | 21,630 | 8.5% | 2,255 Mbps | 7.4 | C+ | 82/100 |
| Dolton | 21,452 | 0.0% | 1,794 Mbps | 6.1 | C- | 72/100 |
| Park Forest | 20,867 | 43.6% | 3,149 Mbps | 7.1 | B- | 70/100 |
| Alsip | 20,384 | 97.1% | 2,195 Mbps | 7.7 | A- | 54/100 |
| Harvey | 20,329 | 0.1% | 2,000 Mbps | 6.2 | C | 62/100 |
| Evergreen Park | 19,945 | 100.0% | 4,889 Mbps | 9.1 | A | 77/100 |
| Homewood | 19,777 | 66.4% | 3,920 Mbps | 7.4 | B | 77/100 |
| Brookfield | 19,368 | 91.9% | 4,700 Mbps | 8.3 | A- | 73/100 |
| La Grange | 18,856 | 80.6% | 4,289 Mbps | 8.1 | B+ | 90/100 |
| Bellwood | 18,698 | 86.3% | 4,496 Mbps | 8 | B+ | 68/100 |
| Palos Hills | 18,530 | 20.0% | 2,459 Mbps | 7.1 | B- | 60/100 |
| Franklin Park | 18,502 | 60.0% | 3,722 Mbps | 7.6 | B | 72/100 |
| Riverdale | 18,030 | 1.7% | 1,670 Mbps | 5.3 | C- | 56/100 |
| Bridgeview | 17,112 | 21.6% | 2,627 Mbps | 6.9 | B- | 51/100 |
| Country Club Hills | 17,017 | 30.5% | 2,910 Mbps | 7.5 | B- | 77/100 |
| Westchester | 16,892 | 95.2% | 4,777 Mbps | 8.3 | A- | 59/100 |
| Prospect Heights | 16,677 | 7.8% | 2,230 Mbps | 7.8 | B- | 61/100 |
| Norridge | 15,211 | 73.0% | 3,956 Mbps | 7.3 | B | 59/100 |
| Glenview Nas | 15,139 | 28.4% | 2,701 Mbps | 8.2 | B- | 84/100 |
| Midlothian | 14,877 | 97.4% | 3,410 Mbps | 8.8 | A- | 51/100 |
| Justice | 14,469 | 0.0% | 1,995 Mbps | 6.5 | C | 65/100 |
| Forest Park | 14,461 | 47.2% | 3,070 Mbps | 6.2 | B- | 58/100 |
| Hickory Hills | 14,420 | 36.4% | 3,092 Mbps | 7.2 | B- | 68/100 |
| Chicago Ridge | 14,404 | 50.7% | 3,476 Mbps | 6.8 | B- | 71/100 |
| Palos Heights | 14,062 | 4.6% | 1,979 Mbps | 6.1 | C | 71/100 |
| La Grange Park | 13,929 | 81.5% | 4,343 Mbps | 7.8 | B+ | 81/100 |
| Western Springs | 13,911 | 75.1% | 4,077 Mbps | 7.8 | B+ | 93/100 |
| Lincolnwood | 13,476 | 36.1% | 3,020 Mbps | 8.4 | B | 76/100 |
| Hazel Crest | 13,446 | 15.0% | 2,450 Mbps | 6.8 | C+ | 66/100 |
| Winnetka | 13,210 | 0.2% | 1,878 Mbps | 6.6 | C | 95/100 |
| Richton Park | 13,000 | 28.5% | 2,742 Mbps | 7.3 | B- | 69/100 |
| Northlake | 12,840 | 52.4% | 3,474 Mbps | 8.2 | B | 60/100 |
| River Forest | 11,717 | 90.3% | 4,128 Mbps | 7.6 | B+ | 87/100 |
| Schiller Park | 11,714 | 1.2% | 1,996 Mbps | 6.3 | C | 59/100 |
| Markham | 11,656 | 58.5% | 3,081 Mbps | 7.7 | B | 69/100 |
| Worth | 11,216 | 0.9% | 1,968 Mbps | 6.6 | C | 35/100 |
| Summit | 11,161 | 28.7% | 2,863 Mbps | 5.6 | C+ | 52/100 |
| Crestwood | 10,826 | 12.3% | 2,173 Mbps | 8.1 | B- | 52/100 |
| Lyons | 10,817 | 21.7% | 2,075 Mbps | 7.2 | B- | 62/100 |
| River Grove | 10,612 | 57.0% | 3,668 Mbps | 7.6 | B | 58/100 |
| Palos Park | 10,138 | 0.0% | 1,900 Mbps | 7.1 | C | 71/100 |
| Sauk Village | 10,024 | 0.0% | 1,762 Mbps | 5.6 | C- | 74/100 |
| Flossmoor | 9,822 | 49.8% | 3,494 Mbps | 7.8 | B | 91/100 |
| Riverside | 9,471 | 72.1% | 4,084 Mbps | 7 | B | 83/100 |
| Glenwood | 9,332 | 9.4% | 2,283 Mbps | 5.7 | C | 62/100 |
| Harwood Heights | 9,239 | 66.7% | 3,432 Mbps | 7.8 | B | 41/100 |
| Lynwood | 9,162 | 21.6% | 2,421 Mbps | 5.8 | C+ | 78/100 |
| Glencoe | 8,849 | 12.7% | 2,304 Mbps | 6.6 | C+ | 90/100 |
| Hillside | 8,737 | 68.7% | 4,064 Mbps | 8 | B+ | 69/100 |
| Broadview | 8,011 | 75.6% | 4,202 Mbps | 8.1 | B+ | 55/100 |
| Orland Hills | 7,993 | 40.8% | 2,505 Mbps | 7.1 | B- | 80/100 |
| Inverness | 7,721 | 0.0% | 2,000 Mbps | 6.9 | C | 92/100 |
| North Riverside | 7,426 | 61.4% | 3,843 Mbps | 7.4 | B | 54/100 |
| Stickney | 7,110 | 85.0% | 4,549 Mbps | 6.5 | B | 71/100 |
| Calumet Park | 7,025 | 99.9% | 2,814 Mbps | 8.8 | A | 65/100 |
| Countryside | 7,008 | 37.2% | 3,116 Mbps | 7.3 | B- | 66/100 |
| Northfield | 5,751 | 20.4% | 2,587 Mbps | 7.4 | B- | 77/100 |
| Willow Springs | 5,749 | 37.4% | 3,087 Mbps | 7.4 | B- | 70/100 |
| Posen | 5,632 | 25.6% | 2,615 Mbps | 7 | B- | 60/100 |
| Barrington Hills | 5,418 | 3.0% | 2,061 Mbps | 7.3 | C+ | 81/100 |
| Berkeley | 5,338 | 89.2% | 4,676 Mbps | 8 | A- | 65/100 |
| South Barrington | 5,077 | 20.4% | 2,609 Mbps | 7.2 | B- | 86/100 |
| Olympia Fields | 4,739 | 34.8% | 3,000 Mbps | 7.4 | B- | 68/100 |
| Robbins | 4,633 | 2.0% | 2,047 Mbps | 7.8 | C+ | 56/100 |
| Stone Park | 4,576 | 45.8% | 3,315 Mbps | 7.7 | B | 63/100 |
| Hometown | 4,343 | 100.0% | 5,000 Mbps | 8.5 | A | 57/100 |
| Indian Head Park | 4,065 | 42.5% | 3,276 Mbps | 7.8 | B | 74/100 |
| Burnham | 4,046 | 18.7% | 2,268 Mbps | 6.5 | C+ | 77/100 |
| South Chicago Heights | 4,026 | 3.4% | 2,122 Mbps | 6.2 | C | 38/100 |
| Rosemont | 3,952 | 0.0% | 2,000 Mbps | 5.7 | C- | 34/100 |
| Dixmoor | 2,973 | 0.6% | 2,000 Mbps | 6.8 | C+ | 58/100 |
| Kenilworth | 2,514 | 45.1% | 2,293 Mbps | 7.5 | B- | 96/100 |
| Thornton | 2,389 | 0.0% | 2,000 Mbps | 6.5 | C | 59/100 |
| Merrionette Park | 1,969 | 53.1% | 3,594 Mbps | 6.4 | B- | 59/100 |
| Ford Heights | 1,813 | 0.0% | 1,987 Mbps | 6.3 | C | 29/100 |
| Phoenix | 1,708 | 38.4% | 2,000 Mbps | 7 | B- | 62/100 |
| Hodgkins | 1,500 | 58.7% | 3,760 Mbps | 8 | B | 40/100 |
| East Hazel Crest | 1,297 | 0.0% | 2,000 Mbps | 6.2 | C | 55/100 |
| Forest View | 792 | 89.4% | 4,622 Mbps | 6.6 | B+ | 78/100 |
| Bedford Park | 655 | 68.4% | 4,047 Mbps | 6.2 | B- | 29/100 |
| Golf | 514 | 0.0% | 2,000 Mbps | 7.4 | C | 84/100 |
| McCook | 249 | 0.0% | 2,000 Mbps | 5.1 | C- | 40/100 |
| Sag Bridge | 173 | 0.0% | 1,804 Mbps | 6.8 | C | 55/100 |
| Hines | 125 | 0.0% | 1,200 Mbps | 6.1 | C- | 21/100 |
ZIP codes in Cook County
| ZIP code | People | Homes with fiber | Average top speed | Providers at a typical address | Report card | Connectivity |
|---|---|---|---|---|---|---|
| 60629 (Chicago) | 114,470 | 19.9% | 2,377 Mbps | 6.9 | C+ | 49/100 |
| 60623 (Chicago) | 92,646 | 9.0% | 1,954 Mbps | 5.9 | C | 47/100 |
| 60632 (Chicago) | 92,035 | 21.4% | 2,214 Mbps | 6.4 | C+ | 48/100 |
| 60618 (Chicago) | 90,225 | 97.7% | 3,641 Mbps | 9.2 | A- | 74/100 |
| 60639 (Chicago) | 89,579 | 30.7% | 1,992 Mbps | 6 | C+ | 54/100 |
| 60647 (Chicago) | 85,882 | 98.5% | 3,896 Mbps | 9.3 | A | 73/100 |
| 60804 (Cicero) | 85,673 | 3.5% | 2,102 Mbps | 5.5 | C | 55/100 |
| 60617 (Chicago) | 77,310 | 1.8% | 1,535 Mbps | 6.5 | C | 56/100 |
| 60625 (Chicago) | 76,649 | 61.1% | 2,328 Mbps | 7.5 | B | 72/100 |
| 60634 (Chicago) | 75,473 | 90.6% | 3,715 Mbps | 7.9 | B+ | 62/100 |
| 60614 (Chicago) | 73,133 | 54.4% | 2,475 Mbps | 8.5 | B | 74/100 |
| 60657 (Chicago) | 72,378 | 59.4% | 2,317 Mbps | 8.3 | B | 73/100 |
| 60608 (Chicago) | 70,183 | 6.4% | 1,765 Mbps | 6 | C | 61/100 |
| 60641 (Chicago) | 69,539 | 92.8% | 3,671 Mbps | 8.2 | A- | 65/100 |
| 60620 (Chicago) | 66,535 | 14.8% | 1,849 Mbps | 7.5 | C+ | 47/100 |
| 60640 (Chicago) | 66,486 | 25.8% | 1,948 Mbps | 8.1 | B- | 62/100 |
| 60609 (Chicago) | 65,356 | 14.0% | 1,777 Mbps | 6.4 | C+ | 55/100 |
| 60402 (Berwyn) | 64,706 | 89.0% | 4,505 Mbps | 7.2 | B+ | 69/100 |
| 60619 (Chicago) | 62,989 | 18.9% | 1,812 Mbps | 6.4 | C+ | 36/100 |
| 60628 (Chicago) | 62,816 | 0.2% | 1,571 Mbps | 7.6 | C+ | 49/100 |
| 60651 (Chicago) | 62,390 | 26.8% | 1,994 Mbps | 6.4 | C+ | 53/100 |
| 60016 (Des Plaines) | 61,895 | 44.5% | 2,837 Mbps | 7.9 | B | 69/100 |
| 60453 (Oak Lawn) | 58,418 | 77.7% | 4,253 Mbps | 8 | B+ | 68/100 |
| 60638 (Chicago) | 56,946 | 82.6% | 3,936 Mbps | 7.5 | B+ | 68/100 |
| 60622 (Chicago) | 55,201 | 99.3% | 2,610 Mbps | 8.4 | A- | 76/100 |
| 60056 (Mount Prospect) | 55,121 | 18.3% | 2,540 Mbps | 7.8 | B- | 81/100 |
| 60616 (Chicago) | 54,567 | 19.0% | 1,597 Mbps | 7.5 | C+ | 57/100 |
| 60630 (Chicago) | 53,903 | 85.3% | 3,905 Mbps | 8.2 | B+ | 68/100 |
| 60411 (Chicago Heights) | 53,538 | 4.5% | 1,973 Mbps | 6.3 | C | 61/100 |
| 60637 (Chicago) | 53,491 | 13.1% | 1,812 Mbps | 6.6 | C+ | 57/100 |
| 60613 (Chicago) | 52,465 | 52.4% | 2,363 Mbps | 9 | B | 70/100 |
| 60004 (Arlington Heights) | 52,445 | 25.4% | 2,645 Mbps | 8 | B- | 82/100 |
| 60120 (Elgin) | 50,866 | 23.1% | 2,566 Mbps | 8.2 | B- | 78/100 |
| 60626 (Chicago) | 50,416 | 5.6% | 1,635 Mbps | 7.6 | C+ | 59/100 |
| 60649 (Chicago) | 48,774 | 5.5% | 1,565 Mbps | 4.9 | C- | 37/100 |
| 60645 (Chicago) | 48,281 | 4.2% | 1,636 Mbps | 6.9 | C+ | 73/100 |
| 60643 (Chicago) | 47,740 | 3.4% | 1,562 Mbps | 7.5 | C+ | 67/100 |
| 60644 (Chicago) | 47,358 | 11.0% | 1,820 Mbps | 5.9 | C | 40/100 |
| 60201 (Evanston) | 44,639 | 10.7% | 2,108 Mbps | 7.8 | B- | 69/100 |
| 60610 (Chicago) | 44,341 | 63.1% | 2,793 Mbps | 9.2 | B | 66/100 |
| 60615 (Chicago) | 43,621 | 32.2% | 2,221 Mbps | 6.7 | C+ | 59/100 |
| 60707 (Elmwood Park) | 43,124 | 56.4% | 3,023 Mbps | 7.3 | B | 64/100 |
| 60062 (Northbrook) | 42,799 | 71.6% | 3,677 Mbps | 8.1 | B+ | 77/100 |
| 60660 (Chicago) | 42,423 | 19.0% | 1,699 Mbps | 8 | C+ | 61/100 |
| 60025 (Glenview) | 41,397 | 2.7% | 1,964 Mbps | 7.4 | C+ | 80/100 |
| 60652 (Chicago) | 40,883 | 48.2% | 2,847 Mbps | 7.5 | B | 60/100 |
| 60659 (Chicago) | 40,641 | 25.1% | 2,134 Mbps | 6.9 | C+ | 66/100 |
| 60462 (Orland Park) | 40,634 | 58.8% | 2,335 Mbps | 7.4 | B | 79/100 |
| 60193 (Schaumburg) | 40,495 | 18.9% | 2,456 Mbps | 7.6 | B- | 83/100 |
| 60068 (Park Ridge) | 39,679 | 81.8% | 4,054 Mbps | 8.3 | B+ | 84/100 |
| 60107 (Streamwood) | 39,642 | 6.6% | 2,209 Mbps | 7.7 | B- | 79/100 |
| 60067 (Palatine) | 39,604 | 16.8% | 2,183 Mbps | 7.2 | B- | 85/100 |
| 60090 (Wheeling) | 39,340 | 26.2% | 2,719 Mbps | 7.4 | B- | 75/100 |
| 60611 (Chicago) | 39,297 | 64.6% | 2,712 Mbps | 9.4 | B+ | 70/100 |
| 60074 (Palatine) | 38,117 | 9.5% | 1,975 Mbps | 6.7 | C+ | 80/100 |
| 60624 (Chicago) | 37,800 | 0.5% | 1,816 Mbps | 5.7 | C | 52/100 |
| 60477 (Tinley Park) | 37,461 | 20.7% | 2,619 Mbps | 6.9 | B- | 68/100 |
| 60409 (Calumet City) | 36,079 | 41.9% | 3,208 Mbps | 7.2 | B- | 65/100 |
| 60636 (Chicago) | 34,825 | 0.1% | 1,622 Mbps | 6.1 | C | 46/100 |
| 60612 (Chicago) | 34,709 | 29.2% | 2,306 Mbps | 6.7 | B- | 55/100 |
| 60605 (Chicago) | 34,621 | 58.9% | 2,836 Mbps | 9.2 | B | 65/100 |
| 60076 (Skokie) | 33,927 | 96.4% | 4,094 Mbps | 8.2 | A- | 84/100 |
| 60169 (Hoffman Estates) | 33,778 | 43.4% | 3,066 Mbps | 7.4 | B- | 79/100 |
| 60302 (Oak Park) | 33,606 | 92.7% | 3,879 Mbps | 7.8 | A- | 75/100 |
| 60007 (Elk Grove Village) | 33,542 | 27.7% | 2,071 Mbps | 7.7 | B- | 74/100 |
| 60202 (Evanston) | 33,245 | 5.2% | 1,992 Mbps | 7.5 | C+ | 78/100 |
| 60653 (Chicago) | 33,060 | 24.1% | 1,808 Mbps | 7.4 | C+ | 44/100 |
| 60525 (La Grange) | 32,571 | 62.6% | 3,803 Mbps | 7.8 | B | 80/100 |
| 60005 (Arlington Heights) | 32,556 | 21.1% | 2,323 Mbps | 8.1 | B- | 75/100 |
| 60607 (Chicago) | 31,331 | 47.5% | 2,529 Mbps | 8.1 | B | 71/100 |
| 60714 (Niles) | 31,129 | 27.3% | 2,713 Mbps | 6.3 | C+ | 60/100 |
| 60018 (Des Plaines) | 29,743 | 59.1% | 3,539 Mbps | 8.3 | B | 71/100 |
| 60631 (Chicago) | 29,706 | 81.7% | 4,066 Mbps | 8.1 | B+ | 66/100 |
| 60438 (Lansing) | 29,660 | 10.2% | 2,165 Mbps | 6.7 | C+ | 69/100 |
| 60621 (Chicago) | 29,589 | 12.9% | 1,687 Mbps | 6.3 | C | 37/100 |
| 60459 (Burbank) | 29,447 | 52.2% | 3,558 Mbps | 7.7 | B | 64/100 |
| 60646 (Chicago) | 28,773 | 80.0% | 3,856 Mbps | 7.9 | B+ | 77/100 |
| 60077 (Skokie) | 28,687 | 43.1% | 3,030 Mbps | 7.9 | B | 75/100 |
| 60091 (Wilmette) | 28,636 | 70.7% | 3,781 Mbps | 8 | B+ | 87/100 |
| 60656 (Chicago) | 28,579 | 51.5% | 3,462 Mbps | 7 | B- | 68/100 |
| 60655 (Chicago) | 28,120 | 9.4% | 1,679 Mbps | 7.4 | C+ | 70/100 |
| 60452 (Oak Forest) | 27,235 | 10.6% | 2,204 Mbps | 7.8 | B- | 71/100 |
| 60487 (Tinley Park) | 26,393 | 28.6% | 2,703 Mbps | 6.6 | B- | 81/100 |
| 60467 (Orland Park) | 26,028 | 1.7% | 1,942 Mbps | 6.4 | C | 77/100 |
| 60053 (Morton Grove) | 25,189 | 44.2% | 3,298 Mbps | 7.6 | B | 73/100 |
| 60827 (Riverdale) | 24,998 | 28.9% | 1,994 Mbps | 6.3 | C+ | 59/100 |
| 60160 (Melrose Park) | 24,776 | 40.0% | 3,038 Mbps | 6.4 | B- | 62/100 |
| 60439 (Lemont) | 24,405 | 9.9% | 2,043 Mbps | 6.7 | C+ | 79/100 |
| 60426 (Harvey) | 24,235 | 2.8% | 2,000 Mbps | 6.3 | C | 62/100 |
| 60706 (Norridge) | 24,207 | 70.8% | 3,760 Mbps | 7.5 | B | 51/100 |
| 60153 (Maywood) | 23,608 | 46.9% | 3,147 Mbps | 6.7 | B- | 55/100 |
| 60654 (Chicago) | 23,023 | 58.8% | 2,451 Mbps | 8.7 | B | 70/100 |
| 60406 (Blue Island) | 22,968 | 95.6% | 2,811 Mbps | 8.2 | A- | 55/100 |
| 60008 (Rolling Meadows) | 22,804 | 22.9% | 2,682 Mbps | 8.2 | B- | 74/100 |
| 60164 (Northlake) | 22,378 | 51.5% | 3,403 Mbps | 8 | B | 63/100 |
| 60466 (Park Forest) | 22,032 | 41.9% | 3,105 Mbps | 7.1 | B- | 70/100 |
| 60803 (Alsip) | 21,795 | 94.7% | 2,326 Mbps | 7.6 | B+ | 56/100 |
| 60473 (South Holland) | 21,579 | 8.6% | 2,254 Mbps | 7.4 | C+ | 82/100 |
| 60642 (Chicago) | 21,565 | 80.3% | 2,793 Mbps | 8.4 | B+ | 71/100 |
| 60419 (Dolton) | 21,342 | 0.0% | 1,795 Mbps | 6.1 | C- | 72/100 |
| 60443 (Matteson) | 21,235 | 15.2% | 2,189 Mbps | 6.7 | C+ | 82/100 |
| 60194 (Schaumburg) | 20,808 | 0.9% | 1,985 Mbps | 7.3 | C+ | 80/100 |
| 60093 (Winnetka) | 20,484 | 6.0% | 2,079 Mbps | 6.8 | C+ | 91/100 |
| 60430 (Homewood) | 20,394 | 64.9% | 3,879 Mbps | 7.4 | B | 77/100 |
| 60805 (Evergreen Park) | 19,945 | 100.0% | 4,889 Mbps | 9.1 | A | 77/100 |
| 60513 (Brookfield) | 19,446 | 91.9% | 4,701 Mbps | 8.4 | A- | 73/100 |
| 60104 (Bellwood) | 18,772 | 86.5% | 4,501 Mbps | 8 | B+ | 68/100 |
| 60465 (Palos Hills) | 18,530 | 20.0% | 2,459 Mbps | 7.1 | B- | 60/100 |
| 60131 (Franklin Park) | 18,194 | 60.9% | 3,748 Mbps | 7.7 | B | 72/100 |
| 60304 (Oak Park) | 17,776 | 97.4% | 4,584 Mbps | 7.6 | A- | 87/100 |
| 60445 (Midlothian) | 17,185 | 88.2% | 3,317 Mbps | 8.8 | B+ | 49/100 |
| 60455 (Bridgeview) | 17,017 | 21.8% | 2,630 Mbps | 6.9 | B- | 50/100 |
| 60154 (Westchester) | 16,887 | 95.3% | 4,778 Mbps | 8.3 | A- | 59/100 |
| 60478 (Country Club Hills) | 16,851 | 30.9% | 2,919 Mbps | 7.6 | B- | 77/100 |
| 60546 (Riverside) | 16,819 | 67.2% | 3,973 Mbps | 7.2 | B | 70/100 |
| 60192 (Hoffman Estates) | 16,561 | 11.2% | 2,116 Mbps | 7 | C+ | 93/100 |
| 60070 (Prospect Heights) | 15,798 | 7.8% | 2,229 Mbps | 7.8 | B- | 60/100 |
| 60601 (Chicago) | 15,125 | 61.9% | 2,525 Mbps | 9.4 | B | 74/100 |
| 60429 (Hazel Crest) | 14,607 | 13.8% | 2,414 Mbps | 6.8 | C+ | 65/100 |
| 60457 (Hickory Hills) | 14,505 | 36.2% | 3,085 Mbps | 7.2 | B- | 68/100 |
| 60458 (Justice) | 14,504 | 0.0% | 1,995 Mbps | 6.5 | C | 65/100 |
| 60463 (Palos Heights) | 14,491 | 4.5% | 1,979 Mbps | 6.1 | C | 69/100 |
| 60026 (Glenview Nas) | 14,470 | 28.3% | 2,688 Mbps | 8.2 | B- | 85/100 |
| 60173 (Schaumburg) | 14,372 | 41.5% | 2,722 Mbps | 8.5 | B | 77/100 |
| 60130 (Forest Park) | 14,339 | 46.8% | 3,079 Mbps | 6.2 | B- | 59/100 |
| 60415 (Chicago Ridge) | 14,338 | 50.5% | 3,469 Mbps | 6.8 | B- | 70/100 |
| 60558 (Western Springs) | 13,911 | 75.1% | 4,077 Mbps | 7.8 | B+ | 93/100 |
| 60526 (La Grange Park) | 13,566 | 83.7% | 4,407 Mbps | 7.8 | B+ | 82/100 |
| 60712 (Lincolnwood) | 13,463 | 36.0% | 3,018 Mbps | 8.4 | B | 76/100 |
| 60633 (Chicago) | 13,298 | 58.6% | 2,399 Mbps | 7.7 | B | 68/100 |
| 60471 (Richton Park) | 13,249 | 27.9% | 2,727 Mbps | 7.3 | B- | 70/100 |
| 60501 (Summit) | 11,728 | 31.1% | 2,936 Mbps | 5.7 | C+ | 50/100 |
| 60305 (River Forest) | 11,717 | 90.3% | 4,128 Mbps | 7.6 | B+ | 87/100 |
| 60176 (Schiller Park) | 11,714 | 1.2% | 1,996 Mbps | 6.3 | C | 59/100 |
| 60428 (Markham) | 11,331 | 59.9% | 3,107 Mbps | 7.8 | B | 69/100 |
| 60661 (Chicago) | 11,308 | 57.9% | 3,242 Mbps | 8.5 | B | 77/100 |
| 60482 (Worth) | 11,244 | 1.2% | 1,979 Mbps | 6.6 | C | 35/100 |
| 60171 (River Grove) | 10,868 | 58.1% | 3,700 Mbps | 7.6 | B | 59/100 |
| 60534 (Lyons) | 10,817 | 21.7% | 2,075 Mbps | 7.2 | B- | 62/100 |
| 60464 (Palos Park) | 9,934 | 0.0% | 1,898 Mbps | 7.2 | C | 70/100 |
| 60422 (Flossmoor) | 9,770 | 48.9% | 3,463 Mbps | 7.7 | B | 91/100 |
| 60425 (Glenwood) | 8,779 | 10.0% | 2,302 Mbps | 5.6 | C | 66/100 |
| 60022 (Glencoe) | 8,471 | 13.2% | 2,343 Mbps | 6.6 | C+ | 90/100 |
| 60162 (Hillside) | 8,341 | 70.8% | 4,130 Mbps | 8.1 | B+ | 68/100 |
| 60155 (Broadview) | 7,978 | 75.5% | 4,199 Mbps | 8.1 | B+ | 55/100 |
| 60418 (Crestwood) | 7,946 | 8.4% | 2,036 Mbps | 8 | B- | 56/100 |
| 60469 (Posen) | 6,472 | 22.6% | 2,544 Mbps | 7 | B- | 59/100 |
| 60163 (Berkeley) | 5,338 | 89.2% | 4,676 Mbps | 8 | A- | 65/100 |
| 60480 (Willow Springs) | 5,298 | 40.1% | 3,166 Mbps | 7.5 | B- | 70/100 |
| 60195 (Schaumburg) | 5,282 | 66.9% | 3,827 Mbps | 8.7 | B+ | 77/100 |
| 60461 (Olympia Fields) | 4,785 | 34.4% | 2,990 Mbps | 7.4 | B- | 69/100 |
| 60203 (Evanston) | 4,679 | 100.0% | 4,853 Mbps | 9.1 | A | 91/100 |
| 60472 (Robbins) | 4,639 | 1.3% | 2,027 Mbps | 7.8 | C+ | 56/100 |
| 60165 (Stone Park) | 4,576 | 45.8% | 3,315 Mbps | 7.7 | B | 63/100 |
| 60456 (Hometown) | 4,343 | 100.0% | 5,000 Mbps | 8.5 | A | 57/100 |
| 60606 (Chicago) | 3,790 | 80.8% | 2,209 Mbps | 7.6 | B | 74/100 |
| 60301 (Oak Park) | 3,201 | 58.8% | 3,493 Mbps | 7.3 | B | 64/100 |
| 60043 (Kenilworth) | 2,514 | 45.1% | 2,293 Mbps | 7.5 | B- | 96/100 |
| 60476 (Thornton) | 2,388 | 0.0% | 2,000 Mbps | 6.5 | C | 59/100 |
| 60602 (Chicago) | 1,878 | 58.5% | 3,571 Mbps | 10.7 | B+ | 61/100 |
| 60603 (Chicago) | 1,351 | 63.7% | 1,785 Mbps | 8.9 | B | 63/100 |
| 60604 (Chicago) | 925 | 6.0% | 1,972 Mbps | 7.6 | C+ | 64/100 |
| 60029 (Golf) | 500 | 0.0% | 2,000 Mbps | 7.4 | C | 84/100 |
| 60208 (Evanston) | 226 | 0.0% | 25 Mbps | 0 | F | 47/100 |
| 60141 (Hines) | 68 | 0.0% | 1,200 Mbps | 5 | D+ | 24/100 |
| 60196 (Schaumburg) | 2 | 100.0% | 5,000 Mbps | 10 | A | 87/100 |
Who is the Fastest Internet Provider in Cook County?
Based on both FCC data and unbiased customer ratings, the fastest internet in the county comes from XFINITY from Comcast.
Data Reported to FCC by ISPs: Average Maximum Available in Cook County
| AT&T | 5,000 |
|---|---|
| EarthLink | 5,000 |
| XFINITY from Comcast | 2,000 |
| Zentro Internet | 2,000 |
| Astound Broadband | 1,500 |
| Verizon | 1,000 |
| Google Fiber | 1,000 |
| Viasat | 100 |
| T-Mobile Home Internet | 100 |
| e-vergent | 100 |
| HughesNet | 25 |
How fast is your internet?
Test your connection here and see it next to the speeds providers advertise in Cook County. It takes about 20 seconds and, on a fast line, can move a few hundred MB of data.
Customer Ratings for Cook County Internet Providers
Based on 316 reviews from Illinois internet customers, Verizon is the best internet service provider for Cook County residents. Verizon was rated at an average of 4.00 out of 5 in our report for overall customer satisfaction. T-Mobile Home Internet wins for second-place in Illinois, with 3.86 out of 5 stars and 97.0% coverage in Cook County.
At a national level, based on 4850 national reviews for any of the providers listed above, T-Mobile Home Internet is rated higher than any other provider, with a rating of 4.01 out of 5.
Local, State, and National Ratings for all Cook County Internet Providers
The table below shows average customer ratings from customers in Cook County, Illinois, and customers throughout the country.
| ISP / Tech Type | Cook County Overall | Illinois Overall | National Overall | For Service | ||
|---|---|---|---|---|---|---|
| Verizon |  (3) | (9) | (818) | View Plans | ||
| T-Mobile Home Internet | (7) | (18) | (343) | View Plans | ||
| Viasat |  (0) |  (1) |  (12) | View Plans | ||
| Astound Broadband | (20) | (21) | (122) | View Plans | ||
| AT&T | (31) | (51) | (1052) | View Plans | ||
| Zentro | (6) | (6) | (9) | View Plans | ||
| XFINITY | (90) | (211) | (2385) | View Plans | ||
| GFiber | (0) | (0) | (105) | View Plans | ||
| EarthLink | (0) | (0) | (15) | View Plans | ||
| HughesNet | (0) | (0) |  (25) | View Plans | ||
| e-vergent | (0) | (0) |  (1) | View Plans |
Customer Ratings for Internet Provider Speeds in Cook County
Based on data reported by Cook County ISPs to the FCC, the fastest speeds in the county are available through XFINITY from Comcast. The company offers speeds up to 2,000 Mbps in Cook County. Therefore, the average customer can get up to 1,781 Mbps if they’re willing to purchase the fastest subscription tier available at their homes.
Additionally, actual customers rated their satisfaction with internet speed highest with XFINITY from Comcast. This indicates XFINITY reliably delivers speeds expected by the customer based on the plan they are paying for.
| ISP / Tech Type | Cook County Speed | Illinois Speed | National Speed | For Service | ||
|---|---|---|---|---|---|---|
| T-Mobile Home Internet | (7) | (18) | (343) | View Plans | ||
| Astound Broadband | (20) | (21) | (122) | View Plans | ||
| Verizon | (3) | (9) | (818) | View Plans | ||
| XFINITY | (90) | (211) | (2385) | View Plans | ||
| Viasat | (0) | (1) | (12) | View Plans | ||
| AT&T | (31) | (51) | (1052) | View Plans | ||
| Zentro | (6) | (6) | (9) | View Plans | ||
| GFiber | (0) | (0) | (105) | View Plans | ||
| e-vergent | (0) | (0) | (1) | View Plans | ||
| EarthLink | (0) | (0) | (15) | View Plans | ||
| HughesNet | (0) | (0) | (25) | View Plans |
Who is the Cheapest Internet Provider in Cook County?
Of the providers in Cook County, customers rate Verizon the best for price. Data comes from customers rating their satisfaction with pricing: in Cook County where enough of them have reviewed a provider, otherwise across Illinois or the country. This feedback is valuable because it considers price changes and whether the speeds paid for are worth it.
Verizon is rated 4.67 out of 5 for price, which is higher than the average across all internet providers in the country. AT&T is rated second for affordability, with an average price rating of 3.45 out of 5.
The table below shows how customers in Cook County, Illinois, and the United States rated the affordability of their internet service.
Rated Affordability in Cook County
| ISP / Tech Type | Cook County Affordability | Illinois Affordability | National Affordability | For Service | ||
|---|---|---|---|---|---|---|
| Verizon | (3) | (9) | (818) | View Plans | ||
| Viasat | (0) | (1) | (12) | View Plans | ||
| Astound Broadband | (20) | (21) | (122) | View Plans | ||
| Zentro | (6) | (6) | (9) | View Plans | ||
| AT&T | (31) | (51) | (1052) | View Plans | ||
| T-Mobile Home Internet | (7) | (18) | (343) | View Plans | ||
| XFINITY | (90) | (211) | (2385) | View Plans | ||
| GFiber | (0) | (0) | (105) | View Plans | ||
| e-vergent | (0) | (0) | (1) | View Plans | ||
| EarthLink | (0) | (0) | (15) | View Plans | ||
| HughesNet | (0) | (0) | (25) | View Plans |
Fiber, 5G, Cable and DSL Internet in Cook County
Which Fiber Internet Providers are Available in Cook County?
EarthLink Fiber in Cook County, IL

Availability:
34.0%
Customer Rating:
(6)
Avg. Download Speed
4,010 Mbps
EarthLink offers Fiber service to 34.0% of Cook County homes. Across the county, EarthLink Fiber has speeds up to 4,010 Mbps, with speeds from 1,000 Mpbs up to 5,000 Mbps depending on the address. Upload speeds are symmetrical, meaning they are exactly the same as download speeds for EarthLink Fiber. EarthLink Fiber is rated about the same as other types of internet service available in Cook County from EarthLink in terms of customer satisfaction.
AT&T Fiber in Cook County, IL

Availability:
34.0%
Customer Rating:
(543)
Avg. Download Speed
4,010 Mbps
AT&T offers Fiber service to 34.0% of Cook County homes. Across the county, AT&T Fiber has speeds up to 4,010 Mbps, with speeds from 1,000 Mpbs up to 5,000 Mbps depending on the address. Upload speeds are symmetrical, meaning they are exactly the same as download speeds for AT&T Fiber. AT&T Fiber is rated lower than other types of internet service available in Cook County from AT&T in terms of customer satisfaction.
Astound Broadband Fiber in Cook County, IL

Availability:
10.5%
Customer Rating:
(21)
Avg. Download Speed
1,500 Mbps
Astound Broadband offers Fiber service to 10.5% of Cook County homes. Across the county, Astound Broadband Fiber has speeds up to 1,500 Mbps
Which Fixed Wireless and LTE Internet Providers are Available in Cook County?
T-Mobile Home Internet Fixed Wireless in Cook County, IL

Availability:
97.0%
Customer Rating:
(343)
Avg. Download Speed
74 Mbps
T-Mobile Home Internet offers Fixed Wireless service to 97.0% of Cook County homes. Across the county, T-Mobile Home Internet Fixed Wireless is the only type of service available from the company, with speeds up to 74 Mbps, with speeds from 25 Mpbs up to 100 Mbps depending on the address. Upload speeds differ from download speeds, and are as low 3.0 and as high as 20, with an average of 14 Mbps throughout the county.
Verizon Fixed Wireless in Cook County, IL
Availability:
86.6%
Customer Rating:
(364)
Avg. Download Speed
405 Mbps
Verizon offers Fixed Wireless service to 86.6% of Cook County homes. Across the county, Verizon Fixed Wireless is the only type of service available from the company, with speeds up to 405 Mbps, with speeds from 25 Mpbs up to 1,000 Mbps depending on the address. Upload speeds differ from download speeds, and are as low 6.0 and as high as 75, with an average of 30 Mbps throughout the county.
EarthLink Fixed Wireless in Cook County, IL
Availability:
74.1%
Customer Rating:
(4)
Avg. Download Speed
43 Mbps
EarthLink offers Fixed Wireless service to 74.1% of Cook County homes. Across the county, EarthLink Fixed Wireless has speeds up to 43 Mbps, with speeds from 25 Mpbs up to 100 Mbps depending on the address. Upload speeds differ from download speeds, and are as low 3.0 and as high as 20, with an average of 7.0 Mbps throughout the county.
AT&T Fixed Wireless in Cook County, IL
Availability:
74.1%
Customer Rating:
(205)
Avg. Download Speed
43 Mbps
AT&T offers Fixed Wireless service to 74.1% of Cook County homes. Across the county, AT&T Fixed Wireless has speeds up to 43 Mbps, with speeds from 25 Mpbs up to 100 Mbps depending on the address. Upload speeds differ from download speeds, and are as low 3.0 and as high as 20, with an average of 7.0 Mbps throughout the county.
Zentro Fixed Wireless in Cook County, IL

Availability:
3.2%
Customer Rating:
(7)
Avg. Download Speed
851 Mbps
Zentro Internet offers Fixed Wireless service to 3.2% of Cook County homes. Across the county, Zentro Fixed Wireless is the only type of service available from the company, with speeds up to 851 Mbps, with speeds from 10 Mpbs up to 2,000 Mbps depending on the address. Upload speeds are symmetrical, meaning they are exactly the same as download speeds for Zentro Fixed Wireless.
Google Fiber Fixed Wireless in Cook County, IL

Availability:
1.6%
Customer Rating:
(0)
Avg. Download Speed
850 Mbps
Google Fiber offers Fixed Wireless service to 1.6% of Cook County homes. Across the county, Google Fiber Fixed Wireless is the only type of service available from the company, with speeds up to 850 Mbps, with speeds from 100 Mpbs up to 1,000 Mbps depending on the address. Upload speeds are symmetrical, meaning they are exactly the same as download speeds for Google Fiber Fixed Wireless.
e-vergent Fixed Wireless in Cook County, IL

Availability:
1.1%
Customer Rating:
(1)
Avg. Download Speed
34 Mbps
e-vergent offers Fixed Wireless service to 1.1% of Cook County homes. Across the county, e-vergent Fixed Wireless is the only type of service available from the company, with speeds up to 34 Mbps, with speeds from 10 Mpbs up to 100 Mbps depending on the address. Upload speeds differ from download speeds, and are as low 1.0 and as high as 20, with an average of 5.0 Mbps throughout the county.
Which Cable Internet Providers are Available in Cook County?
XFINITY Cable in Cook County, IL

Availability:
98.9%
Customer Rating:
(2083)
Avg. Download Speed
1,780 Mbps
XFINITY from Comcast offers Cable service to 98.9% of Cook County homes. Across the county, XFINITY Cable is the only type of service available from the company, with speeds up to 1,780 Mbps, with speeds from 1,200 Mpbs up to 2,000 Mbps depending on the address. Upload speeds differ from download speeds, and are as low 35 and as high as 2,000, with an average of 245 Mbps throughout the county.
Astound Broadband Cable in Cook County, IL
Availability:
36.5%
Customer Rating:
(97)
Avg. Download Speed
1,500 Mbps
Astound Broadband offers Cable service to 36.5% of Cook County homes. Across the county, Astound Broadband Cable has speeds up to 1,500 Mbps
Which DSL Internet Providers are Available in Cook County?
EarthLink DSL in Cook County, IL
Availability:
90.2%
Customer Rating:
(5)
Avg. Download Speed
74 Mbps
EarthLink offers DSL service to 90.2% of Cook County homes. Across the county, EarthLink DSL has speeds up to 74 Mbps, with speeds from 10 Mpbs up to 100 Mbps depending on the address. Upload speeds differ from download speeds, and are as low 1.0 and as high as 20, with an average of 15 Mbps throughout the county. EarthLink DSL is rated higher than other types of internet service available in Cook County from EarthLink in terms of customer satisfaction.
AT&T DSL in Cook County, IL
Availability:
90.2%
Customer Rating:
(304)
Avg. Download Speed
74 Mbps
AT&T offers DSL service to 90.2% of Cook County homes. Across the county, AT&T DSL has speeds up to 74 Mbps, with speeds from 10 Mpbs up to 100 Mbps depending on the address. Upload speeds differ from download speeds, and are as low 1.0 and as high as 20, with an average of 15 Mbps throughout the county. AT&T DSL is rated about the same as other types of internet service available in Cook County from AT&T in terms of customer satisfaction.
Customer Reviews for Internet Service Providers in Illinois
Customer Reviews
ISPReports User
XFINITY Cable
November 17, 2026 poor connectivity, latency, inconsistent
ISPReports User
Pavlov Media Fiber
November 13, 2026 
ISPReports User
Zentro
September 17, 2026 Worst ISP ever. Consistently horrible speeds, constant drops in connection, and endless wait times when calling for customer service. They let me pay an extra $30/mo for 7 months for the 1000mbps plan, just to find out (because I suggested it) that the building was not equipped to handle that type of speed. 30 unit building and I can't get 1000mbps?
Hitesh Patel
Astound Broadband
July 29, 2026 this is worst compant when it comes to customer service.new customer called me yesterday to confirm my install today betweem 8 and 12 at 11.08 got a call he is on his way.at 12.30 no show i called to find out and was told they wii call me in 30 min NO CALL called back and they lied that the tech could not get in the property.we dont have any gates in our sub division,its 1.30 and they now telling me to wait 30 min for someone to call me.i say good luck with this call back.
brianna.r.
T-Mobile Home Internet Fixed Wireless
June 13, 2026 my internet runs fairly well. i do pay a monthly bill. i do not have any issues and i have the option to use my cord from the device to the computer.
Rate your provider
Share your experience to help others in your area choose.
Verified customer: we detected your connection is on this provider.
Reviews are independent and unedited. Published after a quick spam check.
Which ISP Should You Choose in Cook County?
The right ISP for you depends upon your needs, but in general we can make the following suggestions:
- The best all-around internet service provider in Cook County is Verizon.
- The fastest internet provider should be XFINITY from Comcast. Considering speed for the money and reliability in speeds, XFINITY from Comcast may be a better choice based on real-world local customer feedback.
- The most affordable internet provider in Cook County is Verizon.
- XFINITY from Comcast, Viasat, and HughesNet has the broadest coverage in Cook County, available to 98.9% of homes, and is most likely to cover your home. To find out exactly what’s available at your home, please use our address search tool.